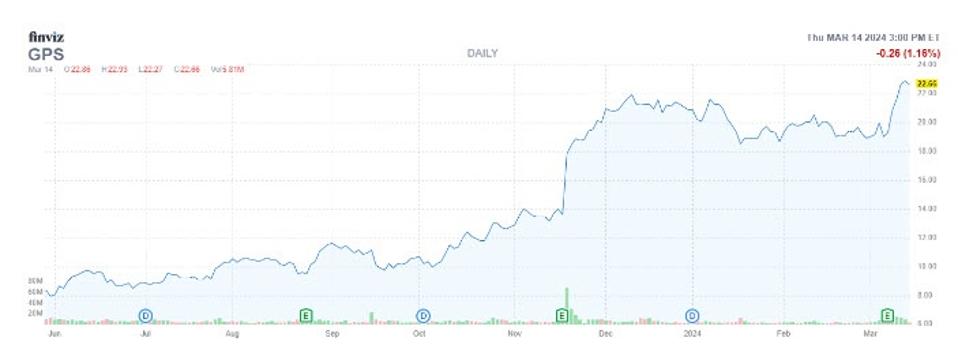
In a similar vein to Abercrombie & Fitch (ANF), retailer Gap (GPS) has rebranded in the last year, and the stock has exploded as a result. GPS is 133% higher year-over-year, riding an 8.2% post-earnings bull gap from March 8 to a March 13 multi-year high of $22.93. The chart below is enticing, featuring a bullish flag pattern after recent consolidation around $19. The better news is that any investors that missed the initial breakout may still have a chance to enjoy the ride, with the shares flashing a historically bullish combination on the charts.
The stock is sporting historically low implied volatility (IV), which coincides with GPS’ recent highs. Per Schaeffer’s Quantitative Analyst Rocky White, there were two other signals during the last five years when Gap was trading within 2% of its 52-week high, while its Schaeffer’s Volatility Index (SVI) stood in the 20th percentile of its annual range or lower.
This is the case with the stock’s current SVI of 41%, which stands in the 6th percentile of annual readings. Per White’s data, the shares were higher one month later after each signal, averaging a 16.2% pop. From its current perch at $22.67, a similar move would place the stock above $26, trading at its highest level since December 2021.
There’s still so much contrarian potential around GPS. Of the 15 brokerages covering the equity, 10 maintain “hold” or worse ratings. And amongst short sellers, a healthy 13.7% of the stock’s total available float is sold short. At GPS’ average pace of trading, it would take four trading days for shorts to buy back their bearish bets.
Those looking to speculate with options should take advantage now. Gap’s Schaeffer’s Volatility Scorecard (SVS) of 74 out of 100 indicates that the equity usually outperforms volatility expectations.

