Some will argue that the quotation, “There are three kinds of lies: lies, damned lies, and statistics,” is not attributed to Mark Twain, but we always think it germane when it comes to the world of investing.
After all, we’ve noticed quite a bit of chatter about the First-5-Days-Of-Trading in January being a proxy for the full year. If stocks rise during that period, it is said that it will be a good market year and vice versa.
One article with statistics dating back to 1950 pointed to a correlation of 69% for stocks (as represented by the S&P 500) closing the year in the same direction as the return over the First 5 Days of the year.
Of course, none other than investment newsletter watchdog Mark Hulbert wrote back in 2021, following a positive First 5 Days:
Unfortunately, this happy conclusion is based on a statistical sleight of hand which, when corrected, makes the alleged pattern disappear.
This doesn’t mean the U.S. market won’t rise this year. The best bet is that it will, since it rises far more often than it falls. My point is that the odds of an “up” year don’t change because of how the market performed in the first five days of this month.
The sleight of hand traces to years in which the stock market rose over the first five trading sessions of January and then fell from then until the end of the year — but still finished higher than it was on Jan. 1. So while these years appear to be a success for the ‘First-5 -Days’ indicator, they actually are a failure. When correcting for this sleight of hand, the indicator does not have a statistically significant success rate.
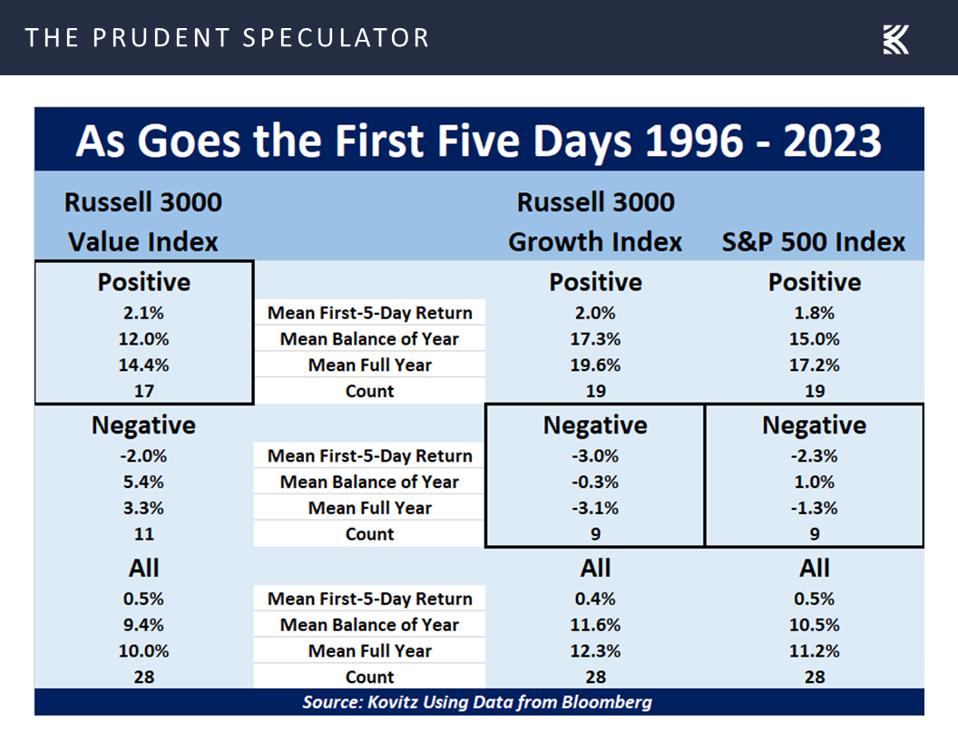
That said, I am a student of market history, so I thought it worthwhile to also take a look at how Value and Growth stocks have performed on the First-5-Days front. True, daily price data available to me goes back only 28 years, so many would find the numbers statistically insignificant, but I don’t mind what the evidence shows for the Russell 3000 Value index.
Thanks to a big rebound on January 8, the Russell 3000 Value index ended 2024’s First 5 Days with a 0.25% positive return, while the Russell 3000 Growth index had a 0.76% negative return and the S&P 500 had a 0.11% negative return.
There is no guarantee that Value history repeats, of course, as 2022, 2018, 2011 and 2002 saw the Russell 3000 Value index start the year up and end the year down, while 1998, 2000, 2005, 2009, 2014, 2016 and 2020 all closed the full year in the black after starting the year in the red.
Still, I can’t complain that Value would seem to have a tailwind (the average return over the balance of the year has been 12.0% following a positive start), while Growth and the S&P 500 would seem to have a headwind (average rest-of-year returns of -0.3% and 1.0%, respectively, following a negative start), based on the First-5-Days indicator!
A VALUE NAME TO CONSIDER
I always advocate broad diversification, but the latest addition last week to TPS Portfolio, a model portfolio for The Prudent Speculator newsletter, was Leggett & Platt.
LEG is a diversified manufacturer serving an array of industries including bedding (coils used in mattresses, specialty foam used in bedding and furniture, and mattresses), automotive, aerospace, and steel wire and rod. Shares returned -14% including dividends in 2023 as the pandemic-related surge in textile and furniture demand waned. Specialized Products, including automotive seating and aerospace tubing, made up 22% of 2022 revenue and has been a bright spot. Management expects low inventories and an aging vehicle fleet to turn into longer-term positives, while cooling commodity cost inflation, production efficiencies and resolution of labor disputes should help widen the segment’s margin. Analysts expect 2023 to be an earnings trough year, before returning to growth. In exchange for patience, I am rewarded with a 6.9% yield, with L&P increasing the payout for more than 50 consecutive years.

