Lululemon’s stock (NASDAQ: LULU) has seen a 55% fall so far this year due to reduced guidance, tariff challenges, and slower product growth. Once valued as a high-growth brand, Lululemon now trades at just 11 times its trailing earnings, which is lower than both its historical average and the S&P 500’s 24 times multiple. While Lululemon’s future performance hinges on boosting U.S. demand and managing rising costs, its recent results have led to a key question: How does LULU stock compare to its peers?
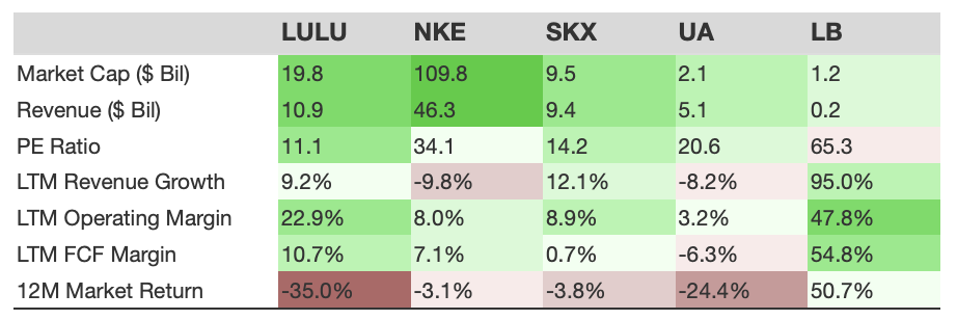
Here is how Lululemon compares with its peers on size, valuation, growth, and margins.
- LULU’s operating margin of 22.9% is elevated—above most peers—but still below LB (47.8%).
- LULU’s revenue growth of 9.2% in the last 12 months is moderate, ahead of NKE and UA, yet behind SKX and LB.
- LULU’s stock is down 35.0% in the last 1 year and trades at a PE of 11.1; it underperformed NKE, SKX, UA, and LB.
As quick context, Lululemon Athletica sells athletic apparel and accessories for women and men through company-operated stores and direct-to-consumer channels across multiple countries worldwide.
Why does this matter? LULU just fell -19.6% in a week—peer context helps frame performance, valuation, and financials to judge whether it is truly outperforming or lagging, and most importantly, whether this can persist. Read Buy or Sell LULU Stock to evaluate if Lululemon Athletica is a falling knife. Sharp dips often present rebound setups—see how the stock has dipped and recovered in the past through the LULU Dip Buyer Analysis lens.
While peer comparison is crucial, the Trefis High Quality Portfolio assesses far more and is built to reduce stock-specific risks while preserving upside potential. Separately, see – What’s Happening With Adobe Stock?
Revenue Growth Comparison
Operating Margin Comparison
PE Ratio Comparison
The Trefis High Quality (HQ) Portfolio, a 30-stock collection, has a history of comfortably outperforming its benchmark across all three—the S&P 500, S&P mid-cap, and Russell 2000 indices. Why? As a group, HQ Portfolio names have delivered better returns with less risk than the benchmark—less of a roller-coaster—visible in the HQ Portfolio performance metrics.

