If a society is going to make intelligent choices in policy, it helps to understand reality, which includes facts and data. People can, of course, misrepresent or misunderstand either, but without the availability of information, the best of intentions must need move trepidatiously.
Or, in less aged parlance, if you walk with a blindfold on a rainy field, there’s a good chance your foot will sink into a mudhole.
Such a lack of information can appear as a form of hiding, as the country has recently seen when parts of the federal government sweep problems under the rug to make them disappear. But the push of everything under cover is obvious in its own way. The world is messy, not spotless.
More difficult is when the data is mixed or comes flooding in from different sources in varying forms. Unfortunately, that seems to be happening in jobs data right now, particularly in layoffs.
Information on layoffs is critical to understanding forces in the labor market and grasp the ongoing movement of employment. At first, the variety of different estimates seems challenging; however, some correlation and analysis make them sound unhappily reasonable.
The Bureau of Labor Statistics in the past had the Mass Layoff Statistics program, which collected reports on mass layoff actions. For those who think it is only the Trump administration that interferes with data collection and analysis, in 2013, then-President Barack Obama ordered spending cuts required by the Balanced Budget and Emergency Deficit Control Act passed by Congress. The BLS had to carve out from its budget more than $30 million, or 5% of the appropriation. The MLS program was eliminated.
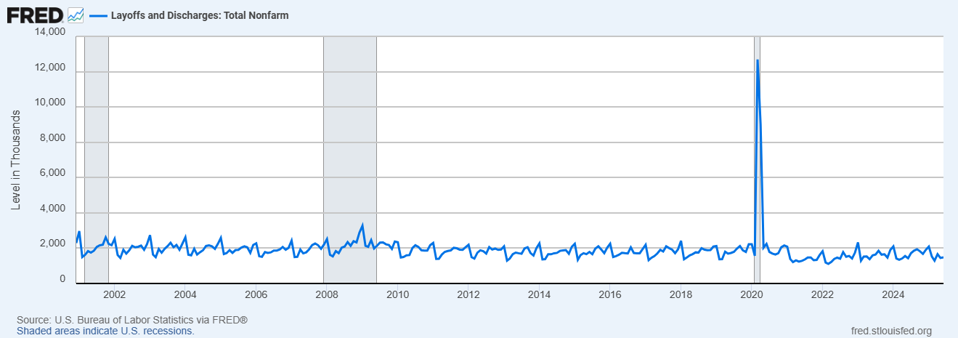
That leaves the BLM layoffs and discharges levels data, mixing layoffs and firings. The graph below, from the Federal Reserve Bank of St. Louis, shows the figures from January 2001 through June 2025.
Other than the pandemic peak in 2020, things are fairly even, with time from 2020 to June 2025 being lower than usual. Within the last couple of years, that means between about 1.3 million to 2.1 million. There is no way to tease out what part is layoffs and what part firings, but it doesn’t seem that ominous.
Here is where things get more confusing. Workforce intelligence analyst Amanda Goodall has been reporting large numbers of layoffs: more than 806,000 in 2025 so far. That may seem incredibly high, but there have been 9.5 million layoffs or discharges from January 2025 through June 2025. If Goodall’s numbers are right, that would be 8.5% of the job losses, which, put that way, doesn’t sound all that odd.
Now tack on data from Layoffs.fyi, a layoffs tracker. By their count, 81,972 tech employees were laid off so far this year and 67,759 government employees were by DOGE, or 178,296 total federal departures in 2025. Even with just the first figure of government layoffs, that would be 149,741 people. Forbes contributor Greg Petro noted an estimated cut of 80,000 retail jobs through July, according to outplacement consultancy Challenger, Gray & Christmas.
That makes almost 230,000 layoffs between tech, retail, and government, with no other industries considered. Goodall’s 806,000 no longer sounds like a far reach.

