Frontdoor (FTDR) a leading provider of home-service plans and on-demand home repair solutions, has seen its stock tumble 21.8% in under a month — sliding from $68.84 on October 27, 2025, to about $53.84 today. With the stock now well off recent highs, investors are asking the obvious question: could Frontdoor rebound back toward $70?
We believe the odds of a recovery are meaningful. The company has a history of sharp dips followed by strong rebounds, and our current assessment views FTDR as Attractive. (See Buy or Sell Frontdoor Stock for the full framework behind this call.)
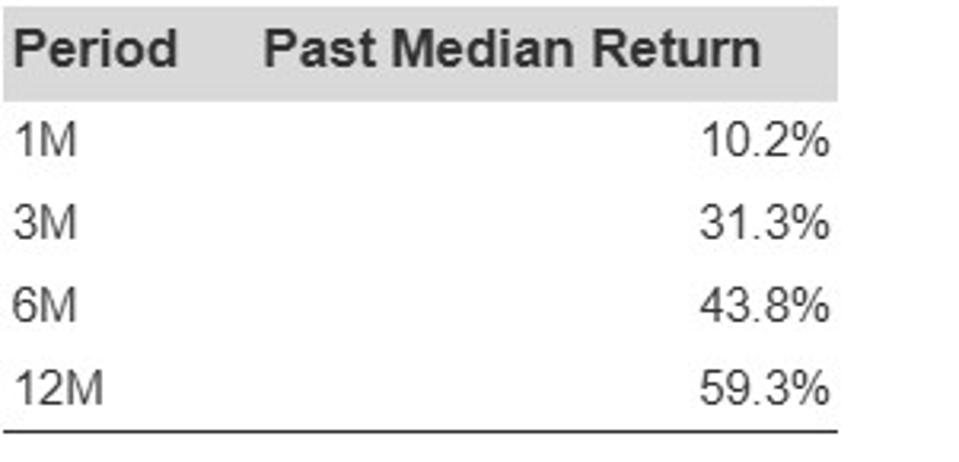
Buying high-quality stocks on pullbacks can be a compelling strategy — and FTDR fits the profile. Historically, after notable declines, the stock delivered a median 12-month return of 59%, with a median peak rebound of 75%. For context, we define a “sharp dip” as a 30%+ drop within 30 days, a threshold Frontdoor has met multiple times.
In the following section, we will delve into the details of past dips and the returns that followed.
Historical Median Returns Following Dips
Historical Dip Analysis
FTDR has encountered 4 events since 1/1/2010 where the dip threshold of -30% within 30 days was reached.
- 75% median peak return within 1 year of the dip event
- 306 days is the median duration to peak return following a dip event
- -5.6% median maximum drawdown within 1 year of the dip event
Frontdoor Meets Essential Financial Quality Standards
To accurately assess the likelihood of a dip indicating a declining business, it is critical to review revenue growth, profitability, cash flow, and balance sheet robustness.
Unsure whether to make a decision regarding FTDR stock? Think about a portfolio strategy.
Portfolios Are The Smarter Way To Invest
Stocks experience ups and downs – the crucial factor is to remain invested. A well-rounded portfolio helps keep you in the market, enhances gains, and lowers the risk associated with individual stocks.
The Trefis High Quality (HQ) Portfolio, which includes a selection of 30 stocks, has a history of significantly outperforming its benchmarks that consist of all three indices – the S&P 500, S&P mid-cap, and Russell 2000. What accounts for this success? As a collective, HQ Portfolio stocks have yielded superior returns while mitigating risks compared to the benchmark index; resulting in a smoother investment experience, as illustrated in HQ Portfolio performance metrics.

