The dip buyer is an algorithm – or maybe even an actual human being – who is programmed by the experience of the last few years to automatically hit the buy button on any decent stock market sell-off. It’s been such a successful strategy over such a long period that it may be hard to accept that, at some point, it stops working.
The bubble psychology finds its way into the system and gets stuck on a kind of recency bias: that is, it’s best to just keep doing what’s worked. The machine-learned trading system likes this way of conducting its business and convinces itself (and its humans) to keep it up.
When the intensified selling starts, the realization that something has really changed may take time to sink in. By then, the wonder that had been dip buying may seem less certain. The new wonder may be that long periods of more or less continuous profit-taking can make powerful adjustments to former ways of thinking.
4 NYSE Stocks Showing Dip Buyer Re-Thinking
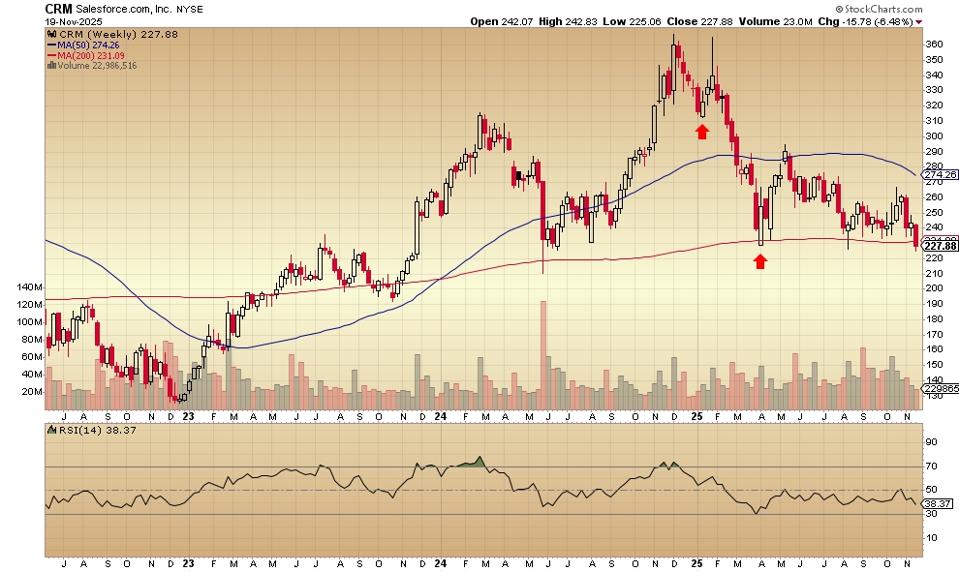
Salesforce.com, the weekly chart, looks like this:
The software application – a Dow Jones Industrials component stock – peaked at the beginning of December 2024. After the price dropped for about six weeks, the dip buyers moved in (marked by the red arrow) and attempted a rally that failed to reach the previous high. Selling picked up and continued into March 2025.
As the price in early April dipped to just below the 200-day moving average (marked by the other red arrow), the dip buyers returned and the stock rallied. This up move ended in early May and the sellers took over again. Now, in early November, Salesforce.com has closed below the 200-week moving average.
Will the dip buyers eagerly return now that the 50-week moving average has turned over?
The daily price chart for Nike is here:
The stock peaked in August with a gap down at the beginning of September and further continuous selling until late September – the red arrow at that point shows where the dip buyers could not longer restraing themselves. The price popped higher and filled the gap.
Then, the selling returned until the second week of October. The dip buyers gave it another shot and took the Nike up to just above $70. Sellers returned and by early November the price had tanked to near $60. Buyers of the dip came in again, it’s bounced and sold off again.
What’s different? The 50-day moving average has just crossed below the 200-day moving average (red circled), a sign of disrepect to the dip buying crowd.
Here’s the daily chart for VeriSign:
Can you see the classic bearish head-and-shoulders pattern that unfolded here from early May to mid-September? Note the August red arrow that indicates dip buyers taking over – but only temporarily. The September high is lower than the late July peak and the next bout of selling takes the price down to below the April low.
Also, dip buying madness may be quelled by the 50-day moving average crossing below the 200-day moving average this week. I’ve red-circled the spot.
The Wix.com daily price chart is here:
Today’s 19% drop comes with heavy duty selling volume. The early August dip buyers are net losers now and so are the mid-October dip buyers. Those spots are indicated on the chart with the red arrows. That the 50-day moving average in mid-April crossed below the 200-day moving average may now be seen as some kind of distant early warning signal.
Stats courtesy of FinViz.com. Charts courtesy of Stockcharts.com.
No artificial intelligence was used in the writing of this post.
More analysis and commentary at johnnavin.substack.com.

