It’s been a handy moniker for business journalists: you could refer to the Mag 7 and ignore most of the other stocks. The magnificent seven – Alphabet, Amazon, Apple, Meta Platforms, Microsoft, Nvidia and Tesla – outperformed month after month when compared to just about anything else listed or unlisted on stock exchanges.
That’s changed now. Although Alphabet managed to gap up and hit a new high this morning, it’s backed off as the day progressed. Meantime, Amazon now trades at $229 after its $255 hight just a few days ago and Apple can’t seem to sustain its late October high of $276. The mobile phone giant now goes for $267.
But wait, there’s more. The Meta Platformes price chart is downright ugly: the stock hit a new high back in August and since then has steadily traded lower and lower. Microsoft’s new high came in late July at $550 and it now goes for $507. Nvidia in late October peaked at just above $210 and has dropped to $186.
Tesla is down from its early November high just above $470 and this morning trades for $415.
It might be time to re-assess how much magnificence is enough.
Mag 7 Price Charts: What Goes Up
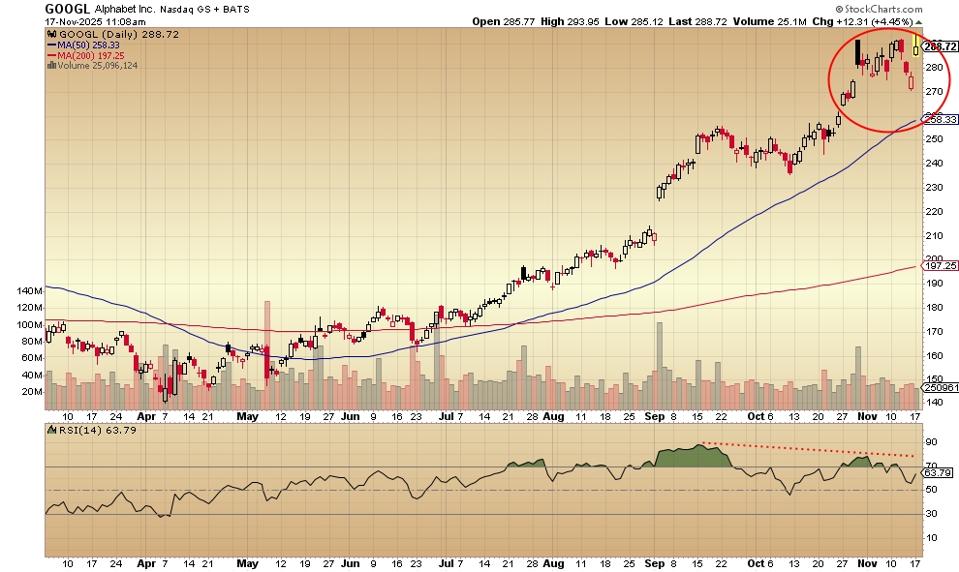
Here’s the Alphabet daily price chart:
The new high is nice. It would have been nice for investors to see it sustained. The lower end of this morning’s gap up may be a target for traders. That’s the potential, given the relative strength indicator’s movement in the opposite direction of price. The 50-day and the 200-day moving averages trend higher, unmistakably.
The Amazon daily price chart looks like this:
The slide from the late October peak to the present is a remarkable move: the stock now trades just barely above its 50-day moving average which has been trending sideways lately. The same could be said of the 200-day moving average, not a great sign for the longer term.
Here’s the Apple daily price chart:
The price this morning dropped lower than the earlier November lows, the previous support level. The stock this month, despite a rally attempt, failed to move above that late October peak. The gap up in mid-October may be a target for near-term traders and their algorithms.
The daily price chart for Meta Platforms is here:
Among all of the Mag 7 stocks, this one looks the worst. Meta peaked in August and has been unable, despite a rally attempt in September, to regain that level. Instead, it’s dropped to below both downtrending 50-day and 200-day moving averages. That late October gap down is remarkable, given the media prominence for this Mag 7 favorite.
Here’s the Microsoft daily price chart:
This is an example of what old-school technical analysts used to call a “double top.” The August high is the peak and the re-attempt to get back up there in late October failed. Since then, the stock has made its way to below the 50-day moving average and managed to stay there for more than a week.
Nvidia’s daily price chart is here:
The stock is back at the uptrending 50-day moving average after two recent visits below it. Dip buying enthusiasm continues to work for the semiconductor giant. If the bloom is coming off the AI rose, this may be hard to sustain. Note that the relative strength indicator peaked in mid-July and has not kept up with price movement since then.
Here’s the Tesla daily price chart:
That’s two closed in a row below the 50-day moving average and the rally so far this morning is unable to make it back above that level. The 200-day moving average is beginning to take on a sidways look rather than an upward look. The relative strength indicator hit is high in September and failed to return there with the early November price high.
If this keeps up, analysts and commentators who’ve been relying on the use of the Mag 7 phrasing may be forced to come up with new material.
Stats courtesy of FinViz.com. Charts courtesy of Stockcharts.com.
No artificial intelligence was used in the writing of this post.
More analysis and commentary at johnnavin.substack.com.

