That these Mag 7 stocks could not make it up to new highs while the S&P 500 and the Nasdaq 100 hit their new highs is peculiar.
It’s the type of negative divergence that probably attracts the attention of Wall Street algorithms designed to be on the lookout for such things and to react according to their highly attuned programming.
Mag 7 Stocks Fail To Hit New Highs While Major Indexes Get There
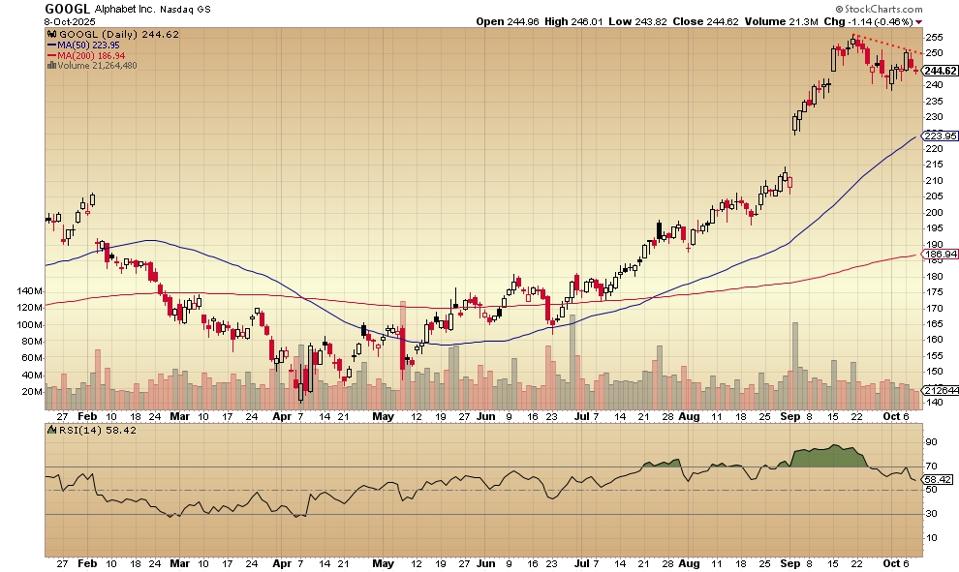
Alphabet
The stock hit a peak of $255 in mid-September, sold off, rallied briefly and now trades for $244. No new high. The upward angle of the 50-day moving average is unusually strong. Today’s close is far above the 200-day moving average. The price-earnings ratio is 34. Alphabet has a market capitalization of $2401.95.
Amazon
The stock peaked in February at just above $240 (not seen on this chart). The early September re-test of that level failed. Today’s closing price was just above $220, just under the 50-day moving average. It appears as if Amazon has now tested the level of the 200-day moving average and managed to remain above it. The price-earnings ratio is 34. Market cap is $2401.95 billion.
Broadcom
The semiconducter giant hit a high of near $370 in early September. Today’s price closed the session at $345. It’s a sign of some weakness that Broadcom is unable to make it up to the old high on a day when the S&P 500 and the Nasdaq 100 both hit new highs. Broadcom’s market cap is $1631.58 billion. The price-earnings ratio is 88.
Meta
The peak at near $800 arrived in August and the stock now goes for $717. An attempted retest of the previous high came in mid-September and failed. Meta Platforms now has nine closing days below the 50-day moving average. Mark Zuckerberg’s internet content company has a market cap of $1803.19 billion. The price-earnings ratio is 26.
Netflix
The stock peaked in late June up there just above $1325 and has since declined to today’s closing price of $1214. It seems to be magnetized since early August to the 50-day moving average. Netflix has a market cap of $515.97 billion. The price-earnings ratio is 51.74.
Tesla
The stock peaked on the first day of October at $470 and today closed at $438 – no new high here for CEO Elon Musk and friends. The 50-day moving average in September crossed above the 200-day moving average, so there’s that. Whether the momentum can be regained remains to be seen. Market cap is $1458.71 billion. The price-earnings ratio is 254.
For comparison’s sake, here are the daily price charts for the S&P 500 and the Nasdaq 100 aka “the major indexes:”
S&P 500
It’s a new high today, just barely. The peak is a bit clearer on the hourly chart, but it’s definitely there.
Nasdaq 100
Today’s new high here is clear as a bell.
Apple is the one Mag 7 name that managed a new high today.
Stats courtesy of FinViz.com. Charts courtesy of Stockcharts.com.
No artificial intelligence was used in the writing of this post.
More analysis and commentary at johnnavin.substack.com.

