Whan you owe more money than you have, it can make it difficult to buy new things – or, if you’re a publicly traded compeany, to grow. Wall Street analysts don’t mind too much debt sometimes, if they’re convinced that the stock can go higher based on other significant factors.
This type of situation is discernable by screening for those equities with price-earnings ratios that are greater than the market as a whole. Finding those, an investor can then take a look at the debt-to-equity ratio and determine their comfort level for such a purchase.
Right now, the p/e for the S&P 500, at 40.08, has only been higher during the 1999 dot-com era. That’s when the analysts and investors couldn’t get enough of names like Qualcom, Pets.com and eToys.com, none of which survived the crash that followed.
Some high p/e stocks from that era survived – guessing right helps.
4 High P/E Nasdaq Stocks With More Debt Than Equity
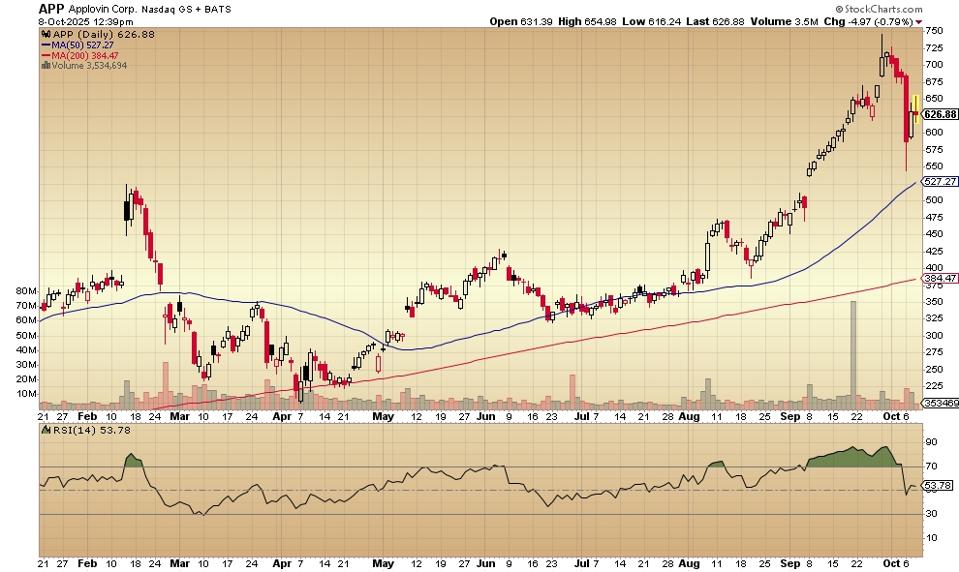
This Palo Alto-based company says that it “helps developers market, monetize, analyze and publish their apps.” The company is reported to be under investigation by the Securities and Exchange Commission for its “data practices,” as noted in this October 8 article by Forbes Senior Contributor Peter Cohan.
Market cap is $211 billion. Applovin is a Nasdaq 100 and an S&P 500 component. The price earnings ratio is 92. The debt-to-equity ratio is 3.01 – that is, the company has just over three times the amount of debt versus its equity. Earnings this year are up 105% and up over the past five years by 84%.
The company provides health information services, headquartered in Denver, with operations throughout the country. The price-earnings ratio is 95. The debt-to-equity ratio is 1.56. This year’s earnings are up 72.87%. Over the past five years, the EPS figure is up 60.10%.
You can see on the daily price chart above that BrightSpring Health is a highly-favored growth stock: it’s traded above both the 50-day and the 200-day moving average for the entire period shown.
The relative strength indicator (RSI, below the price chart) is diverging negatively from the direction of price, from September to the early October peak.
The company, on its website, says investors can “trade stocks…with commision-free investing and advanced trading tools.” The price-earnings ratio is 75.56. The debt-to-equity ratio is 1.96. Earnings this year are up 9.85%. Robinhood hasn’t been around long enough for a three-year or five year earnings record.
Market cap is $132 billion. Robinhood is an S&P 500 component. Investment firm Cantor Fitzgeral in July “reiterated” its “overweight” rating with a then price target of $89 to $100.
Lyft provides a car and a driver for those who are willing to pay for such a service – using software applications. The price-earnings ratio is 97.65. The debt-to-equity ratio is 1.10. Earnings this year are up 5.24%. The company has not been operating long enough for a five year EPS record.
Market cap is $8.69 billion. The company in early September announced a partnership with Waymo designed to intergrate robotaxi services. You can see how the stock gapped up on that day and how it has almost dropped back down to the late October price (filling the gap).
The stock’s price still trades well above both the 50-day and the 200-day moving averages.
Stats courtesy of FinViz.com. Charts courtesy of Stockcharts.com.
No artificial intelligence was used in the writing of this post.
More analysis and commentary at johnnavin.substack.com.

