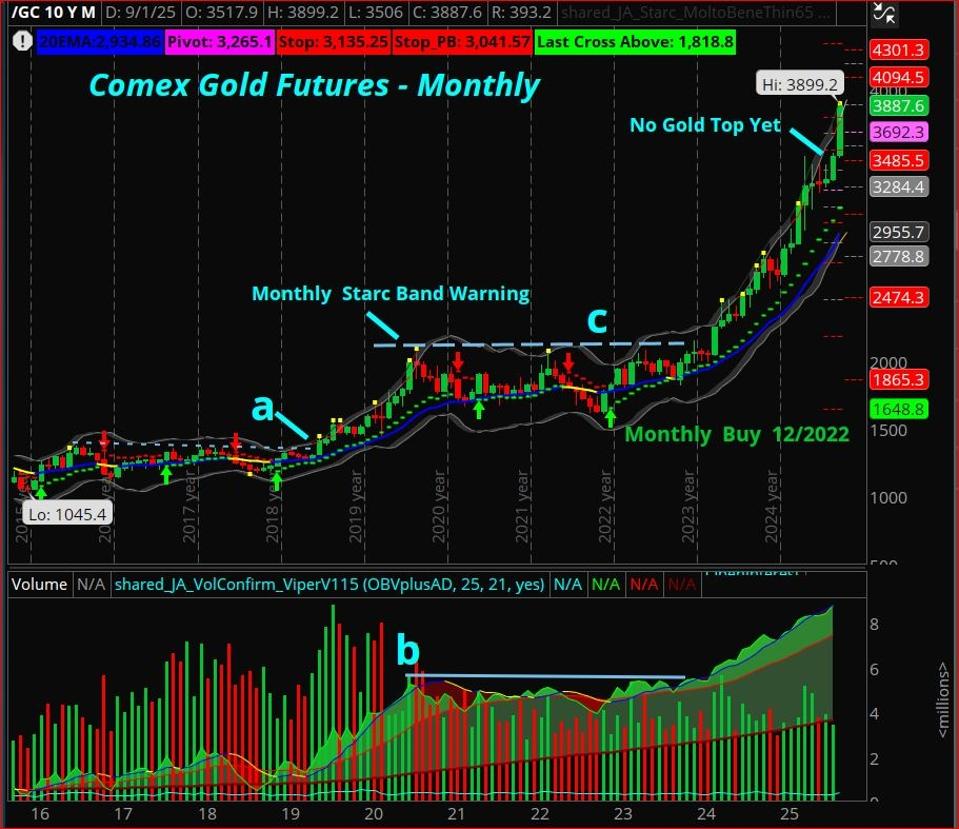
At the end of June, I discussed whether gold had topped as the SPDR Gold Trust (GLD) ended June at $304.83 and was sharply higher for the year. At the time, I commented that “Even though gold is quite overbought based on the monthly starc+ band analysis, it does not yet indicate that gold has formed a major top.”
Often, after gold is under heavy demand, it will form a broad trading range. This is when the recent FOMO buyers eventually get frustrated that prices have not been stronger and sell their positions. Such a range started in 2016, as that range was not completed until the start of 2019.
The monthly analysis requires patience, but it is the most reliable for determining the major trend, as it can clarify the daily and weekly volatility. The breakout of the trading range in 2019 did not occur until June, but the monthly DTS buy signal (green arrow) came in December 2018. The June price breakout was accompanied by a strong signal from Jerry A’s Enhanced OBV, as well as the monthly OBV for the SPDR Gold Trust (GLD) (see chart). In both July and August of 2019, the gold futures exceeded their monthly starc+ bands as noted on the chart by the yellow squares.
From the starc bands analysis, a market that closes above its starc+ band is a higher-risk buy area. That does not mean it can’t still move higher, but the risk is more favorable buying at the starc- bands. In September through December, gold moved sideways to lower until the rally resumed in January. Multiple moves outside the weekly or monthly starc bands are often more significant.
Gold rallied another $600 per ounce by June-July of 2020 as it closed above the starc+ band for two months in a row. From its high above 2000 per ounce, it again formed a trading range that took gold to a low of 1621 in November 2022 before a new monthly DTS buy signal in December 2022.
The completion of the multi-year trading range, line c, did not occur until February 2024, as gold had been out of favor. The selling from the monthly starc+ band warnings was brief until 2025. Gold spiked to another high in March at 3509 and then consolidated for four months before August’s breakout.
Since the February 2024 close at 2254, gold has accelerated to the upside and as of the September 2025 close at 3889 is up 73%. The quarterly pivot for the 4th quarter of 2025 is at 3692 with pivot resistance at 4094 and 4301.
The daily charts are also monitored, though daily breakouts or breakdowns can often be suspect. This year’s action in gold has likely frustrated many, as GLD formed a four-month trading range or continuation pattern highlighted in yellow. There were a multitude of rallies and declines, such as the early May drop from $315.62 to $291 in just seven trading days.
They were likely responsible for a drop in the bullish sentiment that fueled the April rally. Then in late August, the volume picked up in GLD as it accelerated to the upside, gaining 11.8% in September to close above the monthly, weekly, and daily starc+ bands. The width of the trading range has an upside target at $343-$345, which has already been exceeded.
While there are no signs yet of a top, my analysis indicates that the risk is high at current levels. Part of our long positions were sold on Monday’s open at $351.79 as resting orders were hit. At these levels, I would not be buying, even though a move to the $358-$360 area is possible.

