Estée Lauder’s stock has dropped 6% in the past week, continuing a downward trend that began last month. This decline follows the company’s report of a 12% year-over-year decrease in fourth-quarter net sales. The company also issued a profit forecast below analyst estimates and warned of a potential $100 million impact from tariffs, which has made investors wary.
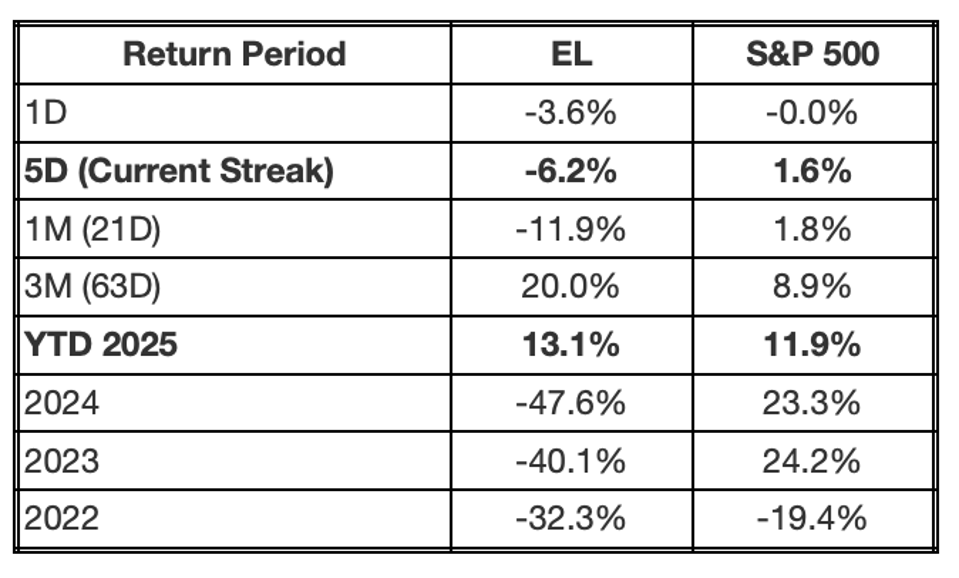
EL stock has now logged 5 straight days of losses. The company has shed about $1.9 billion in market value in the past 5 days, bringing its current market capitalization to around $30 billion. Despite this pullback, the stock remains 13.1% higher than its level at the end of 2024. By comparison, the S&P 500 has gained 11.9% year-to-date.
EL sells a broad portfolio of skincare, makeup, fragrance, and hair care products worldwide, including moisturizers, serums, cleansers, perfumes, and body care items. Is this decline a red flag or a chance for a rebound? Dive deeper with Buy or Sell EL.
That being said, if you seek an upside with less volatility than holding an individual stock, consider the High Quality Portfolio. It has comfortably outperformed its benchmark—a combination of the S&P 500, Russell, and S&P MidCap indexes—and has achieved returns exceeding 91% since its inception. Separately, see – 10x Upside For IONQ Stock?
Comparing EL Stock Returns With The S&P 500
The table below shows EL’s returns compared to the S&P 500 over various timeframes, including the current losing streak:
What’s the takeaway? Sustained weakness can signal more than short-term noise—it may reflect changing sentiment or deeper concerns. A multi-day slide could hint at further downside or offer a buying opportunity if fundamentals are intact. Check what history shows about similar dips: EL Dip Buyer Analysis.
Gains and Losses Streaks: S&P 500 Constituents
Currently, 49 S&P 500 constituents show 3+ days of gains, while 22 show 3+ days of losses.
Key Financials for Estée Lauder Companies (EL)
The ongoing losing streak in EL stock hasn’t inspired much investor confidence. In contrast, Trefis High Quality (HQ) Portfolio, a set of 30 stocks, has consistently outperformed its benchmark, which includes the S&P 500, S&P MidCap, and Russell 2000 indices. Why? HQ Portfolio stocks have historically delivered higher returns with lower risk compared to the benchmark—offering a smoother ride, as shown in the HQ Portfolio performance metrics.

