Even though the S&P 500 and the Nasdaq 100 have recently hit new highs, some big stocks are not going along with the up move. It’s another sign that a few well-publicized tech and social media names, heavily weighted in the indexes, are not necessarily a great measure of overall market performance.
Each of these four stocks has a market capitalization of over $20 billion dollars. All are NYSE or NASDAQ listed. You won’t have to examine the price charts too closely to see that downtrends are in effect for each one. The next time you hear about “new highs for the indexes,” check back for a look at these.
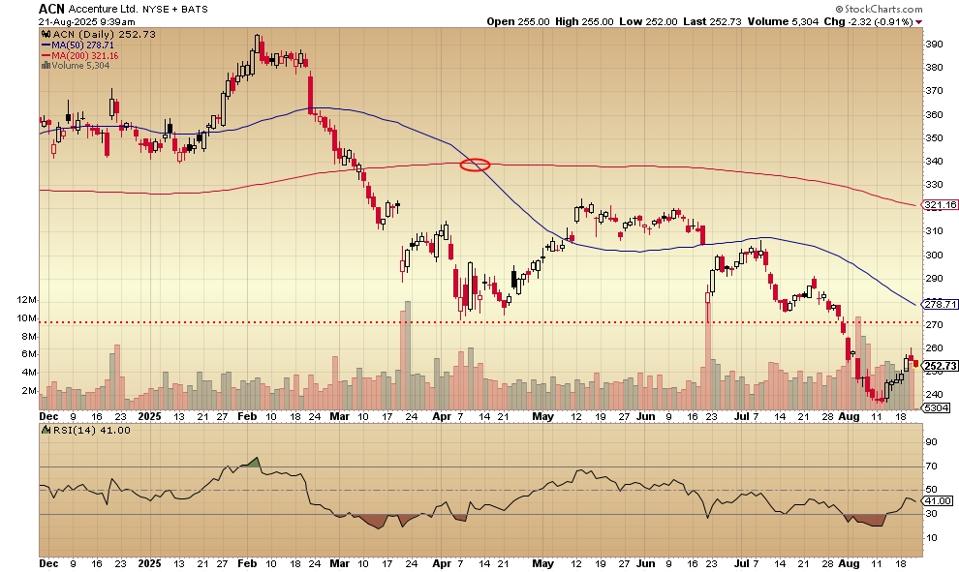
Market cap for Accenture is $158.86 billion. This information technology services firm is based in Ireland and New York Stock Exchange-listed. This year’s earnings are up 7.76% and up over the past five years by 9.21%. The price-earnings ratio is 19.97 and deb-to-equity is .27. The company offers investors a dividend of 2.27%.
The 50-day moving average crossed below the 200-day moving average in early April. The low of that month failed to hold as the stock dropped in late July and hit a new low in mid-August.
The telecommunications company has a market cap of $40.64 billion. The price-earnings ratio is 7.22, substantially lower than other similar big caps in the industry. Earnings this year are up 5.55%. Over the past five years EPS gained 36%. The debt-to-equity ratio is 5.86.
The stock in late July dropped below the previous low from early April. In mid-August, the 50-day moving average crossed below the 200-day moving average.
Market cap comes to $57.51 billion.
Market cap for the Nasdaq-traded Lululemon is $24.59 billion. Headquartered in Vancouver, the apparel company is an S&P 500 component and a Nasdaq 100 component. This year’s earnings are down 1.23% and up over the past five years by 24.32%.
In late April, the stock’s 50-day moving average crossed below its 200-day moving average and continued lower. The June low was taken out in late July and the new low came in August.
Market cap for this biotech is $101.32. It’s a component of both the Nasdaq 100 and the S&P 500. The price-earnings ratio is 28. The debt-to-equity ratio is .09. Earnings this year are up 4199% and up over the past five years by 21.61%. On August 6, Wells Fargo upgraded their opinion of Vertex from “equal weight” to “overweight” with a price target of $460.
The 50-day moving average dropped below the 200-day moving average in early June. After gapping down at the beginning of August, the stock hit a new low and has since bounced from there.
Stats courtesy of FinViz.com. Charts courtesy of Stockcharts.com.
No artificial intelligence was used in the writing of this post.
More analysis and commentary at johnnavin.substack.com.

