In 2025, the U.S. economy has continued to chug along despite the headwinds of tariffs and trade dislocations, as well as the current war in Ukraine and the ongoing conflict in the Middle East. One of the sources of this economic strength has been capital spending by U.S. companies. The main driver has been the buildout of artificial intelligence (AI) capacity, especially by the mega-cap technology companies Amazon, Google, Meta, and Microsoft.
Figure 1: Total U.S. Capital Expenditures, 1950–2025
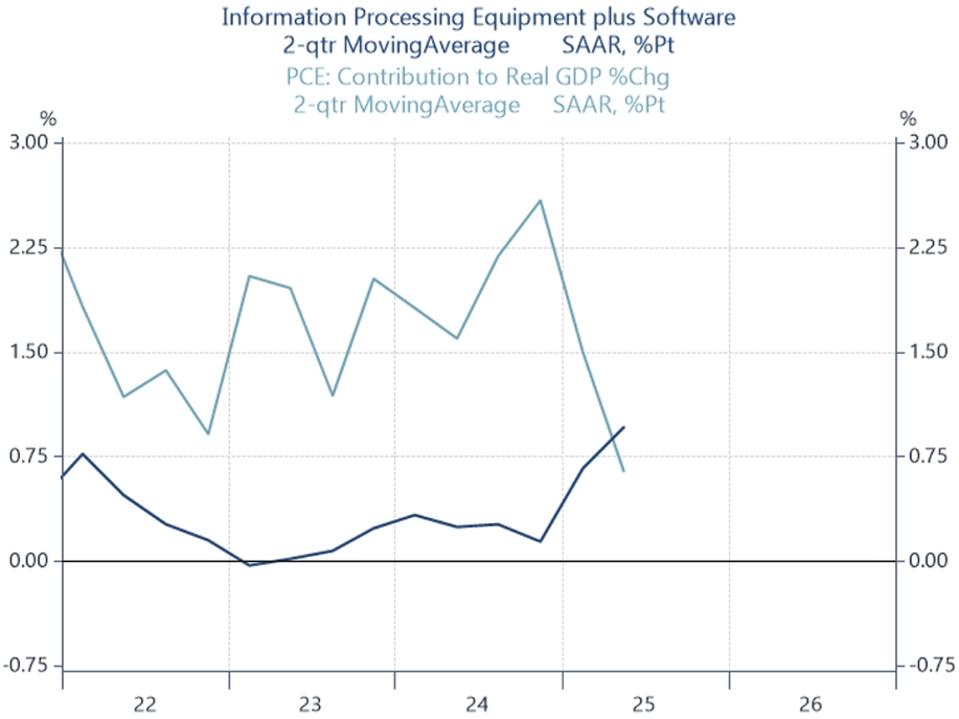
Historically, consumer spending accounts for roughly two-thirds of the U.S. economy. Shockingly, according to a post by Neil Dutta, head of economic research at Renaissance Macro Research, AI spending exceeded consumer expenditures in the last two quarters, as shown in the graphic below. “So far this year, AI capital expenditures (capex), which we define as information processing equipment plus software, have added more to GDP growth than consumer spending,” Dutta said.
Figure 2: U.S. AI Capital Expenditures versus Personal Consumption (PCE), 2022–2025
Christopher Mims of The Wall Street Journal calculates that U.S. AI spending exceeded $100 billion in the previous quarter alone. “The AI infrastructure buildout is so gigantic that in the past six months, it contributed more to the growth of the U.S. economy than all of consumer spending. The Magnificent Seven spent more than $100 billion on data centers and related infrastructure in the past three months alone,” Mims wrote.
Figure 3: Capital Expenditures of META, GOOGL, MSFT, AMZN, 2018–2025
As we discussed in October 2024, there are many sub-groups related to this spending, including the following O’Neil Industry Groups.
Table 1: AI/Data Center-Related O’Neil Industry Groups
A potential accelerant to overall capital spending comes from accelerated depreciation changes included in the recently passed Big Beautiful Bill. This law allows companies to deduct 100% of the depreciation of any qualified project or property in the first year it goes into service. This reduces a business’ taxes and helps improve near-term cash flow by reducing taxable income. This deduction covers most machinery, industrial equipment, computers, servers, and software, as well as some furniture, fixtures, and building components.
As a result, we expect capital spending to rise over the next 12 months in AI and beyond. Thematic areas that may benefit include Power/Electrification, Aerospace, Industrial Manufacturing, Transportation, Telecommunications, and Life Science/Pharma.
Across U.S.-based stocks with a market cap above $500M and at least $50M in annual sales, we analyzed ratios to identify potential beneficiaries. Then, we broke them down by O’Neil Major Industry (89 Groups, combines some of the 197 O’Neil Industry Groups together).
1) Percent of D&A versus sales (most recent annual period): used to find the most capital-intensive businesses, normalized for company size. Across all companies, the median percentage is 4.5%. Here are the major industries with the highest and lowest ratios.
Table 2: Percent of D&A versus Sales of O’Neil Major Industries
2) Percentage of D&A versus total assets (most recent annual period): used to gauge how quickly businesses utilize their capital base, normalized for capital base size. Across all companies, the median percentage is 3.0%. Here are the major industries with the highest and lowest ratios.
Table 3: Percent of D&A versus Assets of Major O’Neil Industries
Major industries that appear on the left side in both of the above tables include Oil and Gas–Exploration/Production, Telecommunication Services, Metal Product and Fabrication, Oil and Gas–Integrated, Chemical, Shipping, Pollution Control, Semiconductors, Cement Aggregates, Agricultural Operation, Leisure Services, Trucking, and Paper and Forest Products. A handful of Health Care segments appear in the D&A versus sales table, while several Retail groups appear in the D&A versus assets table.
Of the groups with higher ratios in each table (33 unique), the groups below are leading and/or reasonably well set-up from a technical perspective.
Figure 4: Weekly Mini Charts of Key O’Neil Major Industries
Despite the potential accelerated depreciation catalyst, tariff headwinds remain. In particular, non-defense capital goods excluding aircraft—which track new orders placed with U.S. manufacturers for durable capital goods designed to last more than three years—have seen mixed momentum. While orders are up from 2024 levels (Figure 5), they have recently pulled back (Figure 6) as businesses put off capital investments despite the tax advantages granted by the Big Beautiful Bill.
Figure 5/6: U.S. Manufacturing Orders and Order Growth, 2022–2025
Overall, much like the Trump corporate tax cuts in his first term, we believe the benefits from the change in depreciation expensing are being underemphasized by the market. While capital goods orders have been weak recently, we think they will rise from current levels as the new law takes effect and tariff uncertainty eases. The above industry lists and charts provide fertile ground for investors interested in this theme. We expect select beneficiaries of the new law to deliver notable stock price outperformance over the next 12 months, and we encourage readers to incorporate this view into their current investment strategy.
Kenley Scott, Director, Global Sector Strategist at William O’Neil + Company, made significant contributions to the data compilation, analysis, and writing for this article.

