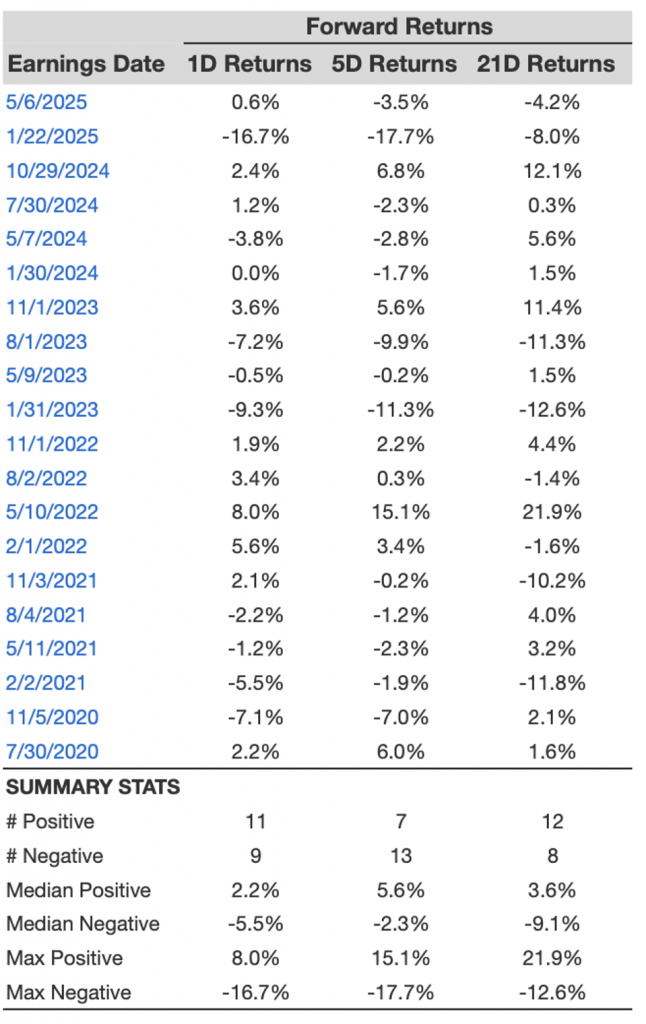
Electronic Arts (NASDAQ:EA) is set to release its earnings on Tuesday, July 29, 2025. Analyzing the previous five years of data, EA stock tends to have positive one-day returns following earnings announcements, occurring in 55% of cases. The median one-day gain was 2.2%, and the largest increase in a single day reached 8.0%.
While the actual results in comparison to consensus estimates will be significant, recognizing these historical trends can offer a benefit for event-driven traders. There are two primary strategies to utilize this information:
- Pre-Earnings Positioning: Traders might opt to position themselves ahead of the earnings announcement, based on the historical probabilities.
- Post-Earnings Analysis: Conversely, traders can evaluate the relationship between immediate and medium-term returns after the earnings are released to guide their positioning.
Analysts’ consensus estimates for the upcoming quarter predict earnings of $0.64 per share on sales of $1.23 billion. This marks a projected decline compared to the earnings from the same quarter last year of $1.01 per share on sales of $1.26 billion.
From a fundamental standpoint, Electronic Arts has a current market cap of approximately $39 billion. Over the past twelve months, the company achieved $7.5 billion in revenue, and was operationally profitable with $1.6 billion in operating profits and a net income of $1.1 billion.
That said, if you are looking for upside with lower volatility compared to individual stocks, the Trefis High Quality portfolio offers an alternative—having outperformed the S&P 500 and delivered returns surpassing 91% since its inception.
View earnings reaction history of all stocks
Electronic Arts’ Historical Odds Of Positive Post-Earnings Return
Here are some insights regarding one-day (1D) post-earnings returns:
- There are 20 earnings data points noted over the last five years, with 11 positive and 9 negative one-day (1D) returns recorded. In total, positive 1D returns were observed around 55% of the time.
- Interestingly, this percentage rises to 58% if we analyze data from the last 3 years instead of 5.
- The median of the 11 positive returns is 2.2%, while the median of the 9 negative returns is -5.5%
Additional information for the observed 5-Day (5D) and 21-Day (21D) returns post earnings is compiled along with the statistics in the table shown below.
Correlation Between 1D, 5D, and 21D Historical Returns
A relatively lower-risk strategy (although not useful if the correlation is weak) is to understand the relationship between short-term and medium-term returns after earnings, identify a pair exhibiting the highest correlation, and implement the suitable trade. For instance, if 1D and 5D exhibit the greatest correlation, a trader can position themselves “long” for the following 5 days if the 1D post-earnings return is positive. Here is some correlation data derived from 5-year and 3-year (more recent) history. Please note that the correlation 1D_5D refers to the correlation between 1D post-earnings returns and the following 5D returns.
Discover more about Trefis RV strategy that has outperformed its all-cap stocks benchmark (a combination of all 3: the S&P 500, S&P mid-cap, and Russell 2000), generating substantial returns for investors. In addition, if you’re looking for upside with a smoother experience than investing in an individual stock like Electronic Arts, consider the High Quality portfolio, which has surpassed the S&P and achieved >91% returns since its inception.

