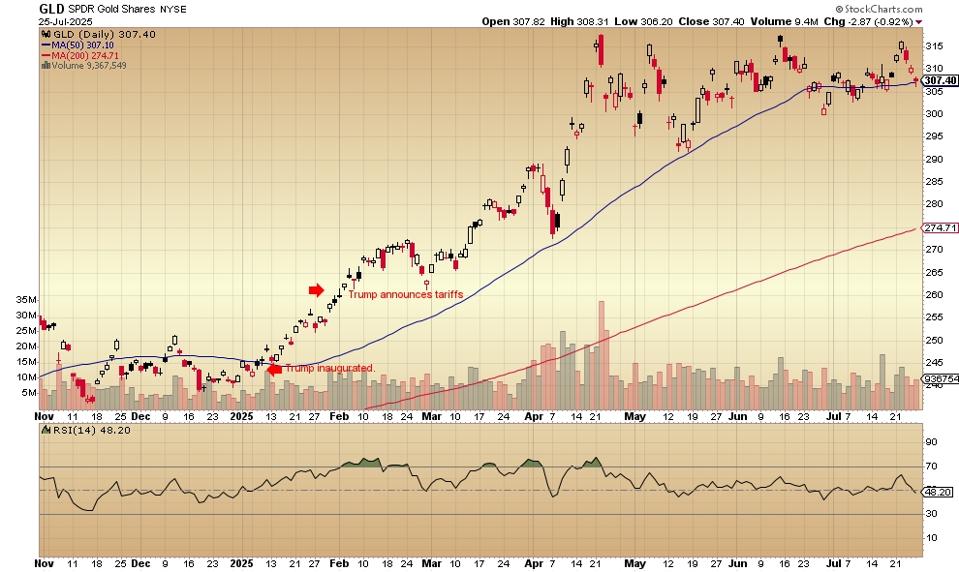
To explain why the three big NYSE gold stocks have had such a good 2025, start with tariffs, inflation and the price trend of the metal.
That tariffs and inflation go together is hard to dispute despite what Trump and advisors want you to believe.
All you have to do is look at the gold chart from the date that the tariffs were introduced. The yellow metal is the classic inflation hedge.
Here’s the daily for the SPDR Gold Shares which closely tracks gold bullion:
The price on February 1st, when Trump announced the tariffs, was $260. The shares now trades for $307.40 which amounts to an 18% gain in six months.
Newmont Mining is the gold stock mostly likely to be added to a portfolio by Wall Street money managers. That’s because it’s big and highly liquid. The market cap is $68.36 billion. Average daily volume is 12.32 million shares.
The Denver-based miner has operations in Nevada, in British Columbia, in Ghana, in Australia and in South America. This year’s earnings per share are up 40.32%. Over the past three years they’re up 25% and over the past five years down by 5.57%. The stock trades with a price-earnings ratio of 13.79, well below that of the S&P 500 at 38.79.
Newmont pays a dividend of 1.63%.
The Newmont Mining daily price chart is here:
The stock traded for $43 on February 1 and this week hit a new high of above $65 on some of the heaviest volume of the year. Note that the 50-day moving average crossed above the 200-day moving average in mid-April and that the price remains above both in July.
Agnico Eagle has a market cap of $64.30 billion. Average daily volume is 3.06 million. The company is headquartered in Toronto and maintains operations throughout Canada as well as in the US, Mexico and Australia. Earnings per share this year are up 64.11% and up over the past five years by 27.13%.
Agnico Eagle’s price-earnings ratio is 27.03. The debt-to-equity ratio is a low .06. Raymond James on June 30, 2025 resumed coverage of the stock with an “outperform” rating and a price target of $130.
The Agnico Eagle daily price chart looks like this:
Shares could have been purchased on February 1 for $92.50. By mid-July the price had reached $130 and remains above both the 50-day and the 200-day moving averages.
Wheaton Precious Metals is based in Vancouver and benefits from streaming royalties of gold (and silver) mines operating in North America, South America, Africa and Australia. The market cap is $43.10 billion. Average daily volume amounts to 1.85 million shares.
This year’s earnings per share are up 68.06% and up over the past five years by 43.30%. The company has no debt, long-term or otherwise, on its books. In April, BMO Capital Markets issued an “outperform” rating for the stock with a price target of $129. Wheaton Precious Metals pays a .73% dividend.
Here’s the daily price chart for Wheaton:
The price on February 1, when the tariffs were first announced, was near $63. The mid-July high was near $96. Wheaton Precious Metals continues to trade above the 50-day moving average and well above the 200-day moving average.
Any investor who, on the first of February, thought “Hmm, tariffs mean higher inflation and that means major gold stocks will benefit, so I’ll buy them” has done well.
Stats courtesy of FinViz.com. Charts courtesy of Stockcharts.com.
No artificial intelligence was used in the writing of this post.
More analysis and commentary at johnnavin.substack.com.

