Zoetis (ZTS) the world’s largest animal-health company, develops and manufactures medicines, vaccines, and diagnostics for both pets and livestock. The stock has come under pressure in recent months as softer clinic traffic, uneven companion-animal demand, and a narrowed full-year outlook weighed on sentiment. Yet the pullback has also driven valuations toward multi-year lows—an unusual reset for a business known for high margins, steady cash generation, and decades-long leadership in animal health. With core fundamentals holding up better than the share price implies, the setup allows investors to reassess whether this high-quality compounder is now trading at a meaningful discount.
Here’s an overview of the company’s positive developments. In the third quarter of 2025, organic operational revenue from livestock increased by 10% driven by vaccine demand and enhanced penetration amongst key accounts. The Simparica franchise also witnessed a 7% operational expansion, influenced by a 6% increase from Simparica Trio. Although the overall organic revenue growth was 4%, a 9% organic increase in adjusted net income highlights effective cost management. New product approvals, such as Lenivia for canine osteoarthritis pain and the Vanguard Recombishield vaccine, broaden future offerings. Despite a narrowed full-year revenue guidance due to macro trends and reduced clinic visits, which caused a temporary drop in stock prices, initiatives are in progress to stabilize the OA pain portfolio and propel 2026 growth with new product introductions.
What does this mean in terms of numbers? Let’s discuss them.
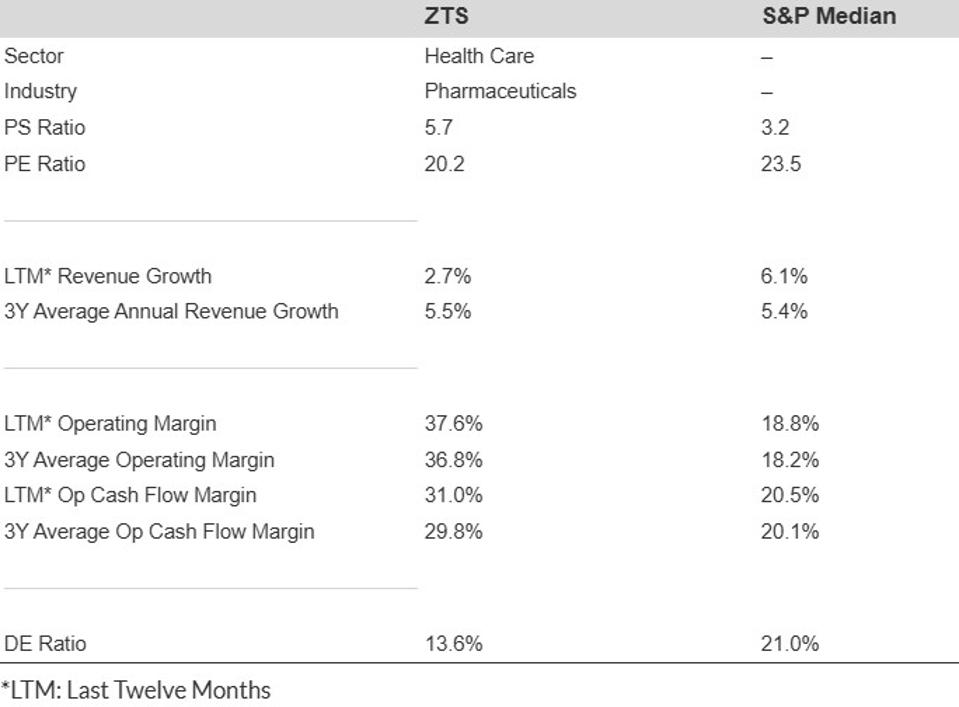
- Revenue Growth: Zoetis recorded a growth of 2.7% LTM and a 5.5% average over the last three years, but this isn’t a growth narrative.
- Recent Profitability: Operating cash flow margin stands at nearly 31.0% and operating margin at 37.6% LTM.
- Long-Term Profitability: Approximately 29.8% operating cash flow margin and 36.8% operating margin over the last three years.
- Available At Discount: At a P/S multiple of 5.7, ZTS stock is available at a 35% discount compared to one year ago.
While revenue growth is beneficial, this does not represent a growth perspective. Pricing power and high margins yield consistent, predictable profits and cash flows, thereby reducing risk and enabling capital to be reinvested. The market tends to reward such metrics.
Below is a brief comparison of ZTS fundamentals with S&P medians.
If you would like more information, read Buy or Sell ZTS Stock. However, it is known that clients have a strong attachment to their favorite stocks, but the risk of holding a single stock can erase years of profits. Savvy financial advisors manage diversification smartly – discover how our Boston-based wealth management partner can assist.
Stocks Like These Can Outperform. Here Is Data
This is how we make our selections: We look at stocks with > $10 Bil in market capitalization and then include those with high CFO (cash flow from operations) or operating margins. Furthermore, we only consider those stocks that have seen a significant decline in valuation over the past year.
Below are figures for stocks following this selection strategy since 12/31/2016.
- Average 12-month forward returns of approximately 19%
- 12-month win rate (percentage of picks returning positive) of around 72%
In conclusion, we choose stocks that have declined despite apparently strong fundamentals – so it is useful to ask, what is the risk?
Risk Quantified
ZTS is not exempt from significant drops. It fell about 17% during the 2018 correction, 36% during the Covid pandemic, and nearly 47% during the inflation crisis. Even with robust fundamentals, the stock can still suffer a substantial decline when the market turns unfavorable. High quality can cushion risk but cannot eliminate it.
Moreover, the risk is not confined to large market crashes. Stocks may decline even in favorable market conditions – consider events such as earnings reports, business updates, and outlook modifications. Read ZTS Dip Buyer Analyses to learn how the stock has rebounded from previous sharp declines.
The Trefis High Quality (HQ) Portfolio, which features 30 stocks, has a history of comfortably outperforming its benchmark, which includes all three indices: the S&P 500, S&P mid-cap, and Russell 2000. What accounts for this? As a whole, the HQ Portfolio stocks have delivered superior returns with lower risk compared to the benchmark index; presenting a steadier performance, as demonstrated in the HQ Portfolio performance metrics.

