After a strong run, the S&P 500 and Nasdaq closed down 1.6% and 3.0% last week. It was another test of the ongoing uptrend which has been in place since mid-April, triggered by a follow-through day (FTD*) on April 22. Over the 29 weeks since William O’Neil shifted the market to a Confirmed Uptrend (April 22), here are some key stats in Table 1.
*FTD is defined as +1.7% or greater move at least four days off established lows, on volume above prior day.
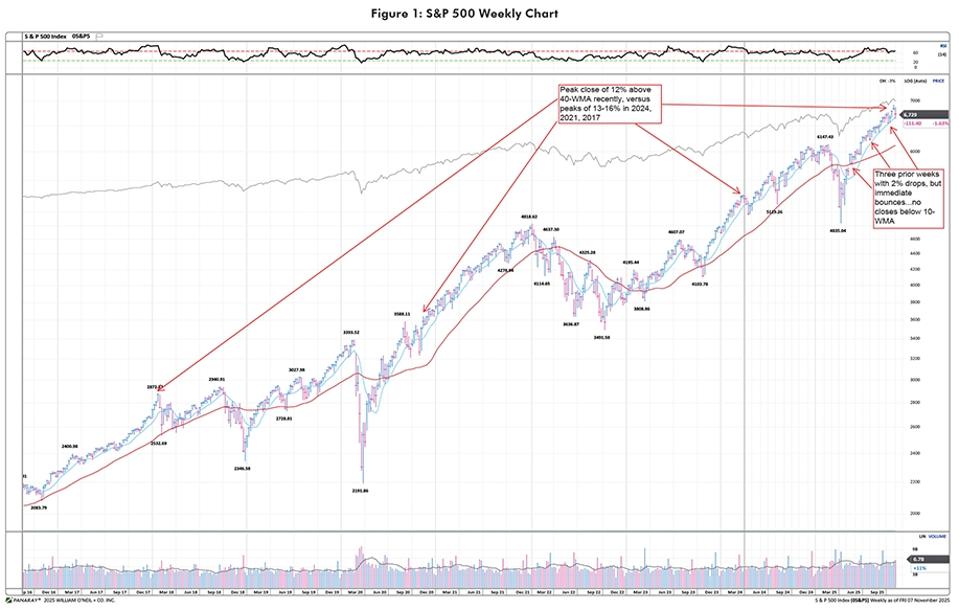
Through the exceptional move higher, the main indices have sustained three weekly pullbacks of -2 –2.5% on the weeks ended 5/23, 8/1, and 10/10. The key for each pullback was an immediate bounce the following week, which averaged a gain of +2.0% for the S&P 500 and +2.6% for the Nasdaq. See the weekly chart of the S&P 500 in Figure 1 below. Also, while the index touched the 10-WMA on multiple occasions, it has not had a weekly close below since retaking the level in early May.
Underneath the large indices, there have been interesting divergences and moves in secondary indicators.
The proportion of bullish versus bearish investment advisors has become stretched. Bulls reached 59% last week, albeit before the selloff later in the week. While this is not at historical extremes, which are closer to 65%, it is well into the upper end of the sentiment range. The bears did reach near-extreme lows, briefly below 14% last week —a level that has only been breached a handful of times over 40+ years as shown in Figures 2 and 3.
Breadth has been narrow. Though this has been far less important than the large market cap stocks for the main indices, it can still leave the market in a vulnerable position when supported by stocks. Narrow breadth is oftentimes less indicative of a continuing bull market. Figure 4 shows that starting the week of November 10, only roughly 48% of stocks were above their 30-WMA.
By sector, Technology has clearly dominated with a 50%+ gain after the April follow-through day. Related to the divergence in breadth, only Technology and Consumer Cyclical have beaten the S&P 500 since the April FTD, and only Technology has beaten the Nasdaq as seen in Figure 5. The average (+14%) and median (+16%) gain for the other nine sectors is only about half of the S&P 500 gain over that time. This concentration of leading stocks makes us nervous. If Technology, driven by the AI theme, was to roll over, there is not another sector clearly poised to take the lead.
In September, we wrote about the most extended areas of the market, including stocks that were exhibiting climax top behaviors. The few dozen stocks that were included in that note were down a median of 7% last week, and despite still having a median 97 RS Rating, are a median of about 18% off highs. About two-thirds were from Technology, fintech/crypto, and AI infrastructure groups. Another 15% were from precious metals and gold/metals mining.
Since the Technology sector (and strong winning areas like microcap and hypergrowth) led the way lower last week, we believe the market needs either a strong bounce in these leading areas, similar to what has occurred after the past three one-week drops, or support emerging from multiple other sectors. If this does not occur, it would suggest to us that the market tenor has changed, and an intermediate top may be forming.
We will look at post-Q3 earnings reactions across groups for clues.
Kenley Scott, Director, Global Sector Strategist at William O’Neil + Company, made significant contributions to the data compilation, analysis, and writing for this article.

