Gentex (GNTX) has long been known for its automotive mirrors and smart glass technologies. But the company is becoming much more than that. It’s quietly expanding into advanced safety and connected vehicle systems, widening its footprint in the auto tech space. Profitability has remained steady, backed by a strong balance sheet and disciplined management. Innovation is at the center of its strategy, with new products and acquisitions driving growth opportunities. With an impressive cash yield, solid fundamentals, and an appealing valuation, Gentex looks well positioned for its next chapter.
Gentex’s acquisition of VOXX drove an 8% increase in consolidated sales during Q3 2025 and improved gross margins through operational synergies. There remains a robust demand for Full Display Mirror technology, with anticipated 2025 shipments rising by 200,000 to 300,000 units from last year. The company also introduced groundbreaking dimmable glass, driver monitoring systems, and connected car products at CES 2025. The management has updated the 2025 consolidated revenue forecast to $2.5-$2.6 billion, reflecting these advancements.
What does this mean in terms of numbers?
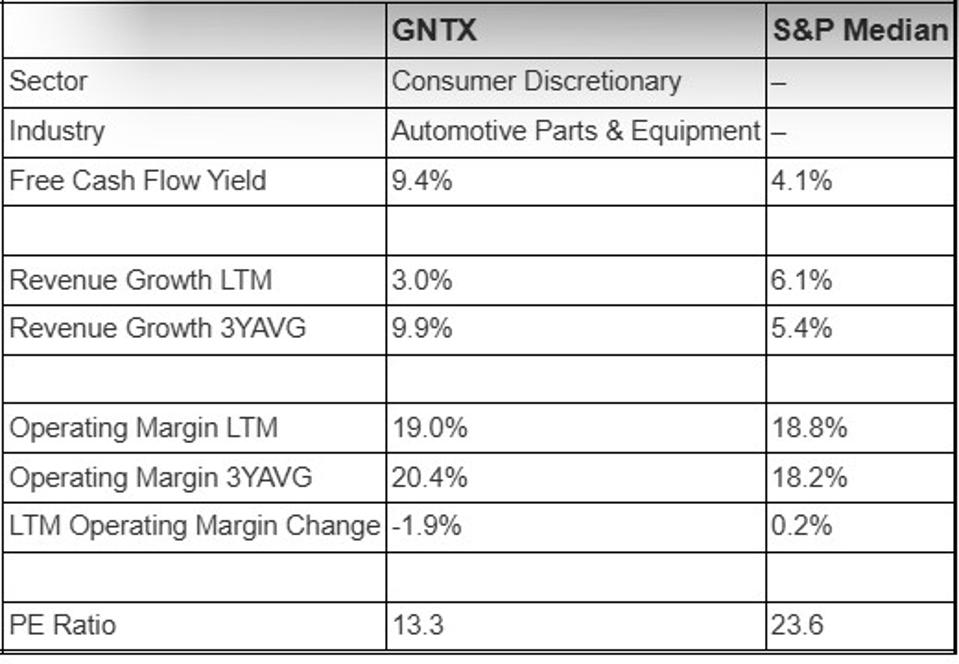
- Solid Cash Yield: Few stocks provide a free cash flow yield of 9.4%, but Gentex stock does.
- Strong Margin: The operating margin over the last 12 months is 19.0%.
- Growth: Revenue growth over the last 12 months is 3.0%—though modest, this selection prioritizes high yield and margin.
- Valuation: GNTX stock is currently trading at 35% below its 2-year high, 14% below its 1-month high, and at a price-to-sales ratio lower than its 3-year average.
Why prioritize Free Cash Flow Yield? It is calculated as free cash flow per share divided by stock price, and it is significant. If a company generates a substantial amount of cash per share, it can be utilized for further revenue growth or distributed to shareholders via dividends or buybacks. Below is a quick comparison of GNTX’s cash flow yield and other financial fundamentals against the S&P median.
For additional information and our perspective, refer to Buy or Sell GNTX Stock. However, the excitement of stock-picking can quickly diminish amid volatility. Savvy financial advisors maintain an edge by pairing insights with action, directing client capital into diversified portfolios that perform across various market cycles.
The Market Can Identify Such Stocks and Provide Rewards
The statistics below are derived from a high FCF yield selection strategy implemented between 12/31/2016 and 6/30/2025. The stats have been computed based on selections made monthly, under the assumption that once a stock is selected, it cannot be chosen again for the next 180 days.
- Average forward returns of 10.4% and 20.4% for 6-month and 12-month periods, respectively
- Win rate (percentage of selections yielding positive returns) of around 74% for the 12-month period
- Not overly reliant on market downturns. Even during non-crash phases, this strategy has achieved an average return of nearly 18% over 12 months with a win rate of 70%.
There is no assurance that the market will consistently reward such value stocks, thus it is prudent to inquire—what is the risk?
Risk Explained
GNTX is not immune to significant sell-offs. It fell approximately 57% during the Dot-Com crash and faced an even sharper decline of nearly 70% during the Global Financial Crisis. Both the inflation shock and the Covid pandemic caused a drop of around 35%. Even the correction in 2018 was harsh, pushing shares down by over 25%. The stock possesses strong attributes, but history demonstrates that it can still take a hit when markets weaken.
However, the risk is not restricted to major market crashes. Stocks can decline even in favorable market conditions—events like earnings announcements, business updates, and outlook adjustments can lead to downturns. Review GNTX Dip Buyer Analyses to understand how the stock has bounced back from sharp declines in the past.
The Trefis High Quality (HQ) Portfolio, which consists of 30 stocks, has a history of consistently outperforming its benchmark, including all three—the S&P 500, S&P mid-cap, and Russell 2000 indices. What accounts for this? Collectively, HQ Portfolio stocks have delivered superior returns with reduced risk compared to the benchmark index; offering a smoother ride, as shown in HQ Portfolio performance metrics.

