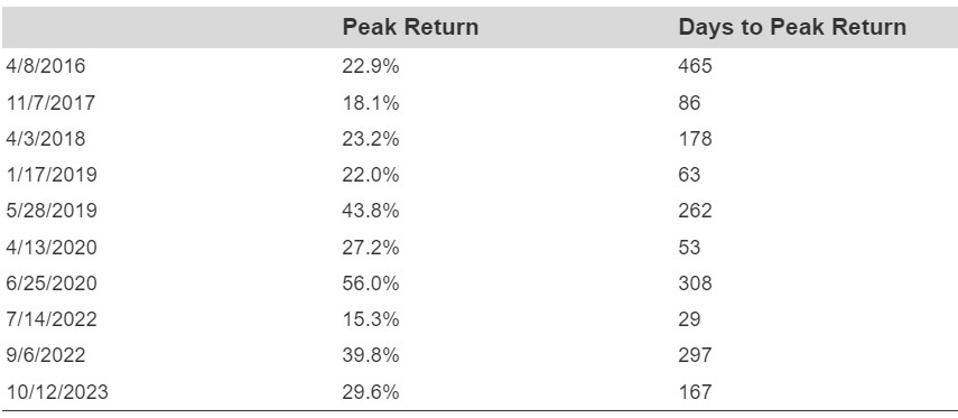
Zimmer Biomet (ZBH) stock ought to be on your radar. Here’s why – it is presently trading within the support range ($83.17 – $91.93), levels from which it has rebounded significantly in the past. Over the last 10 years, Zimmer Biomet stock attracted buying interest at this point 10 times and subsequently achieved an average peak return of 29.8%.
But is the price movement sufficient on its own? It certainly supports the case if the fundamentals align. For ZBH, read Buy or Sell ZBH Stock to evaluate how compelling this buying opportunity may be.
While individual stocks can surge or plummet, one factor remains crucial: staying invested. High Quality Portfolio assists you in achieving that.
Here are some key data points for Zimmer Biomet that may assist in decision-making:
- Revenue Growth: 5.5% LTM and 5.1% three-year average.
- Cash Generation: Approximately 17.6% free cash flow margin and 18.7% operating margin LTM.
- Recent Revenue Surprises: The lowest annual revenue growth in the last three years for ZBH was 4.1%.
- Valuation: ZBH stock trades at a PE multiple of 21.5
For a brief overview, Zimmer Biomet offers orthopedic reconstructive, sports medicine, biologics, trauma, and dental implant products in global markets within the musculoskeletal healthcare domain.
*LTM: Last Twelve Months
What Is Stock-Specific Risk If The Market Crashes?
ZBH is not immune to substantial declines. It dropped 65% during the Global Financial Crisis and nearly 50% amid the Covid pandemic. The 2018 correction and inflation spike each caused losses of at least 26% and 41%, respectively. Thus, even with solid fundamentals, this stock can suffer considerable losses when markets decline. Risk is a reality, regardless of how strong the setup appears.
However, the risk is not confined to significant market downturns. Stocks can decline even when markets are performing well – consider factors such as earnings reports, business updates, and changes in outlook. Read ZBH Dip Buyer Analyses to observe how the stock has bounced back from steep declines in the past.
The Trefis High Quality (HQ) Portfolio, comprising 30 stocks, has a proven history of consistently outperforming its benchmark, which includes all three indices: the S&P 500, S&P mid-cap, and Russell 2000. What accounts for this? Together, HQ Portfolio stocks have yielded superior returns with lower risk compared to the benchmark index, avoiding severe fluctuations, as demonstrated by the HQ Portfolio performance metrics.

