Honeywell (NASDAQ: HON) stock has surged 6.8% over the last trading day and is now priced at $220.67. The recent gains are driven by a stronger than expected set of Q3 results, with adjusted earnings rising 9% to $2.82 per share. The company has also seen its order backlog jump 22%, led by strength in the aerospace technologies and energy and sustainability solutions divisions.
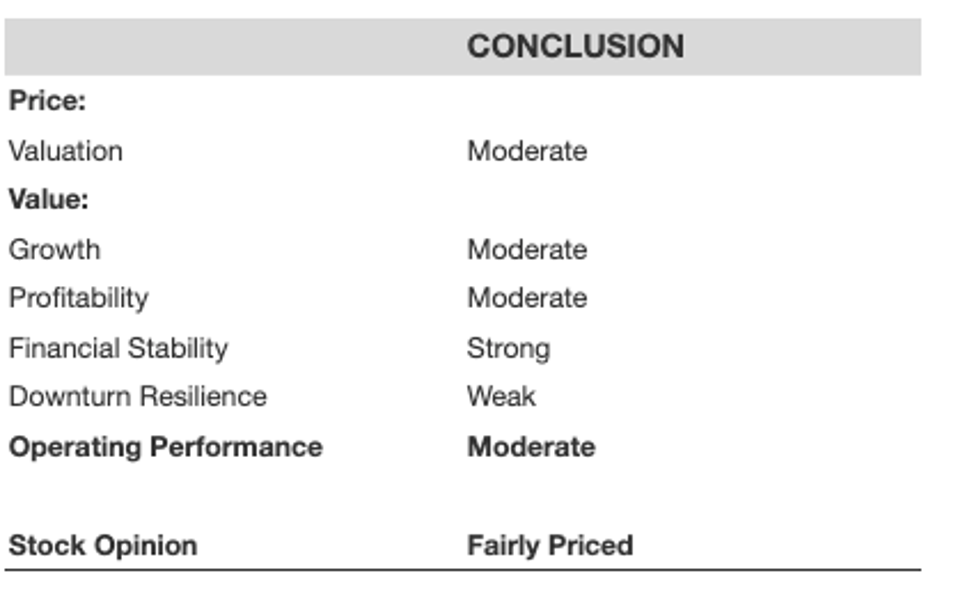
We think there is a balanced mixture of positive and negative aspects in HON stock due to its overall Moderate operational results and financial status. This corresponds with the stock’s Moderate valuation, which is why we consider it to be Fairly Priced.
Below is our evaluation:
HON stock has seen significant growth recently and we currently assess it as fairly priced. This could come across as a warning, as there is a notable risk in depending solely on one stock. Nevertheless, there is substantial value in a more comprehensive diversified approach, which we utilize through the Trefis High Quality Portfolio. Trefis collaborates with Empirical Asset Management – a Boston-based wealth management firm – whose asset allocation strategies provided positive returns during the 2008-09 period when the S&P 500 plummeted by more than 40%. Empirical has integrated the Trefis HQ Portfolio into this asset allocation model to deliver better returns to clients with reduced risk when compared to the benchmark index; resulting in a smoother investment experience, as demonstrated by HQ Portfolio performance metrics.
Let’s delve into details of each of the assessed factors, but first, for a quick overview: With $140 Bil in market cap, Honeywell International offers diversified technology and manufacturing solutions, including building control software and personal protective equipment like apparel, gear, and footwear.
[1] Valuation Appears Moderate
This table illustrates how HON is valued compared to the broader market. For further information, see: HON Valuation Ratios
[2] Growth Is Moderate
- Honeywell International has experienced top line growth at an average rate of 5.2% over the last 3 years.
- Its revenues have increased by 7.5%, rising from $38 Bil to $41 Bil in the past 12 months.
- Additionally, its quarterly revenues grew by 7.0% to $10 Bil in the most recent quarter, up from $9.7 Bil a year prior
This table illustrates how HON grows compared to the broader market. For further details, see: HON Revenue Comparison
[3] Profitability Appears Moderate
- HON’s operating income for the last 12 months totaled $7.7 Bil, representing an operating margin of 18.9%.
- With a cash flow margin of 18.4%, it generated nearly $7.5 Bil in operating cash flow during this period.
- In the same time frame, HON produced nearly $6.1 Bil in net income, indicating a net margin of about 15.1%
This table highlights how HON’s profitability compares to the broader market. For more information, see: HON Operating Income Comparison
[4] Financial Stability Appears Strong
- HON had Debt of $37 Bil at the conclusion of the most recent quarter, while its current Market Cap stands at $140 Bil. This translates to a Debt-to-Equity Ratio of 26.5%.
- HON’s Cash (counting cash equivalents) comprises $13 Bil of $81 Bil in total Assets. This results in a Cash-to-Assets Ratio of 16.5%.
[5] Downturn Resilience Is Weak
HON has performed worse than the S&P 500 index in various economic downturns. This evaluation is based on both (a) the extent of the stock’s decline and (b) the speed of its recovery.
2022 Inflation Shock
- HON stock fell 28.6% from a peak of $233.74 on 16 August 2021 to $166.97 on 30 September 2022, compared to a peak-to-trough decline of 25.4% for the S&P 500.
- However, the stock completely recovered to its pre-Crisis peak by 12 November 2024.
- Since then, the stock has increased to a high of $240.40 on 6 July 2025 and is currently priced at $220.67.
2020 Covid Pandemic
- HON stock decreased by 43.3% from a high of $183.23 on 17 January 2020 to $103.86 on 23 March 2020, compared to a peak-to-trough decline of 33.9% for the S&P 500.
- Nevertheless, the stock fully recovered to its pre-Crisis peak by 5 November 2020.
2008 Global Financial Crisis
- HON stock dropped 62.7% from a peak of $62.25 on 19 May 2008 to $23.23 on 9 March 2009, compared to a peak-to-trough decline of 56.8% for the S&P 500.
- However, the stock returned to its pre-Crisis peak by 19 October 2012.
However, the risk is not confined to major market crashes. Stocks can decline even in favorable market conditions – consider events like earnings releases, business updates, or changes in outlook. Read HON Dip Buyer Analyses to learn how the stock has bounced back from significant declines in the past.
The Trefis High Quality (HQ) Portfolio, featuring a selection of 30 stocks, has a history of consistently outperforming its benchmark, which includes all three indices – S&P 500, Russell, and S&P midcap. What accounts for this? Collectively, HQ Portfolio stocks have provided superior returns with reduced risk when compared to the benchmark index; a smoother ride, as indicated by HQ Portfolio performance metrics.

