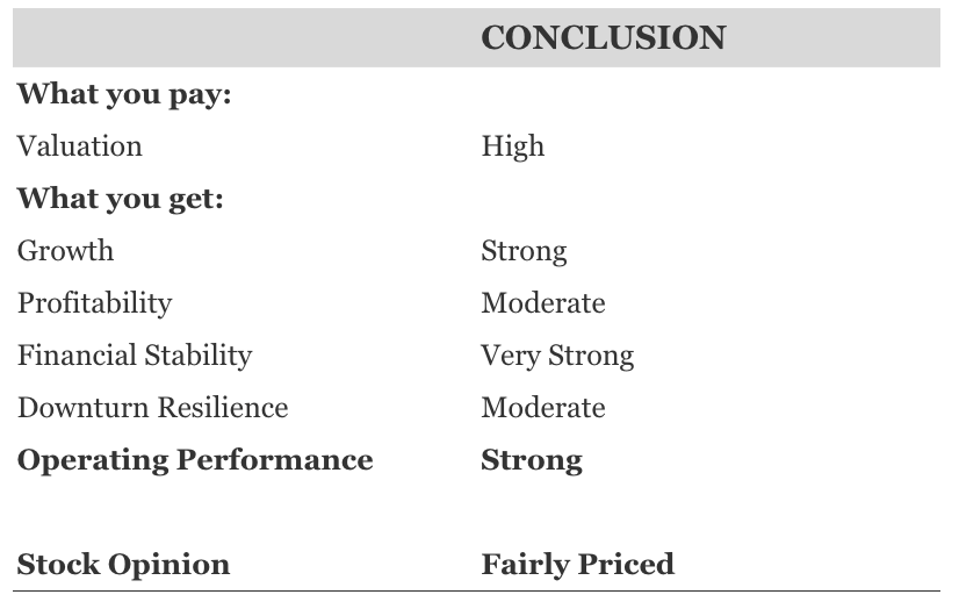
Amazon stock (NASDAQ: AMZN) has performed strongly, rising 27% over the last six months. This impressive rally can be attributed to several factors: stronger-than-expected Q2 earnings, the accelerating growth of its AWS cloud business despite increased competition, expansion in its high-margin advertising segment, and growing confidence from financial analysts.
However, the stock did experience a temporary pullback following the Q2 earnings call, driven by cautious Q3 operating income guidance and persistent, intense competition in the cloud sector.
The critical question now is: Is AMZN stock still a buy at the current level of $215 after seeing these 27% gains?
While we acknowledge the stock’s overall strong operating performance and financial condition, this strength is arguably already reflected in its high valuation. Consequently, we believe the stock is Fairly Priced. In the sections below, we assess AMZN’s latest financial and operating performance, along with its downside resilience.
That being said, if you seek an upside with less volatility than holding an individual stock like AMZN, consider the High Quality Portfolio. It has comfortably outperformed its benchmark—a combination of the S&P 500, Russell, and S&P MidCap indexes—and has achieved returns exceeding 105% since its inception. Why is that? As a group, HQ Portfolio stocks provided better returns with less risk versus the benchmark index; less of a roller-coaster ride, as evident in HQ Portfolio performance metrics.
Let’s get into details of each of the assessed factors, but before that, for quick background: With $2.3 Tril in market cap, Amazon.com provides retail sales of consumer products and subscriptions globally, operates in North America, International, and cloud services, and manufactures electronic devices like tablets, TVs, and smart home products.
[1] Valuation Looks High
This table highlights how AMZN is valued vs the broader market. For more details, see: AMZN Valuation Ratios
[2] Growth Is Strong
- Amazon.com has seen its top line grow at an average rate of 11.3% over the last 3 years
- Its revenues have grown 11% from $604 Bil to $670 Bil in the last 12 months
- Also, its quarterly revenues grew 13.3% to $168 Bil in the most recent quarter from $148 Bil a year ago.
This table highlights how AMZN is growing vs the broader market. For more details, see: AMZN Revenue Comparison
[3] Profitability Appears Moderate
- AMZN’s last twelve-month operating income was $76 Bil, representing operating margin of 11.4%
- With a cash flow margin of 18.1%, it generated nearly $121 Bil in operating cash flow over this period
- For the same period, AMZN generated nearly $71 Bil in net income, suggesting a net margin of about 10.5%
This table highlights how AMZN’s profitability vs the broader market. For more details, see: AMZN Operating Income Comparison
[4] Financial Stability Looks Very Strong
- AMZN Debt was $134 Bil at the end of the most recent quarter, while its current Market Cap is $2.3 Tril. This implies a Debt-to-Equity Ratio of 5.9%
- AMZN Cash (including cash equivalents) makes up $93 Bil of $682 Bil in total Assets. This yields a Cash-to-Assets Ratio of 13.7%
[5] Downturn Resilience Is Moderate
AMZN saw an impact slightly better than the S&P 500 index during various economic downturns. We assess this based on both (a) how much the stock fell and, (b) how quickly it recovered.
2022 Inflation Shock
- AMZN stock fell 56.1% from a high of $186.57 on 8 July 2021 to $81.82 on 28 December 2022, vs. a peak-to-trough decline of 25.4% for the S&P 500.
- However, the stock fully recovered to its pre-Crisis peak by 11 April 2024
- Since then, the stock increased to a high of $242.06 on 4 February 2025, and currently trades at $213.04
2020 COVID-19 Pandemic
- AMZN stock fell 22.7% from a high of $108.51 on 19 February 2020 to $83.83 on 12 March 2020, vs. a peak-to-trough decline of 33.9% for the S&P 500.
- However, the stock fully recovered to its pre-Crisis peak by 14 April 2020
2008 Global Financial Crisis
- AMZN stock fell 65.3% from a high of $5.04 on 23 October 2007 to $1.75 on 20 November 2008, vs. a peak-to-trough decline of 56.8% for the S&P 500.
- However, the stock fully recovered to its pre-Crisis peak by 23 October 2009
But the risk is not limited to major market crashes. Stocks fall even when markets are good – think events like earnings, business updates, outlook changes. Read AMZN Dip Buyer Analyses to see how the stock has recovered from sharp dips in the past.
Remember, investing in a single stock without comprehensive analysis can be risky. Consider the Trefis Reinforced Value (RV) Portfolio, which has outperformed its all-cap stocks benchmark (combination of the S&P 500, S&P mid-cap, and Russell 2000 benchmark indices) to produce strong returns for investors. Why is that? The quarterly rebalanced mix of large-, mid-, and small-cap RV Portfolio stocks provided a responsive way to make the most of upbeat market conditions while limiting losses when markets head south, as detailed in RV Portfolio performance metrics.

