BlackRock (NYSE:BLK) is scheduled to announce its earnings on Tuesday, October 14, 2025. According to consensus projections, revenues are expected to increase by approximately 20% year-over-year, reaching $6.22 billion, while earnings per share are anticipated to be around $11.80. This growth is likely fueled by elevated market levels compared to the same time last year and an increase in organic base fee revenue. Additionally, the company is expected to see an uptick in revenues from technology services and subscriptions. The organization’s current market capitalization stands at $179 billion. Over the past twelve months, revenue totaled $22 billion, demonstrating operational profitability with operating profits of $7.7 billion and a net income of $6.4 billion. While results will largely depend on how they measure against consensus expectations, grasping historical trends could enhance your chances if you are a trader focused on events.
There are two approaches to doing this: either understand the historical probabilities and position yourself before the earnings release or analyze the relationship between immediate and medium-term returns following the earnings announcement, adjusting your position after earnings are disclosed. That being said, if you’re interested in gaining upside with less volatility than individual stocks, the Trefis High Quality portfolio offers an alternative—having outperformed the S&P 500 and achieving returns greater than 91% since its inception.
See earnings reaction history of all stocks
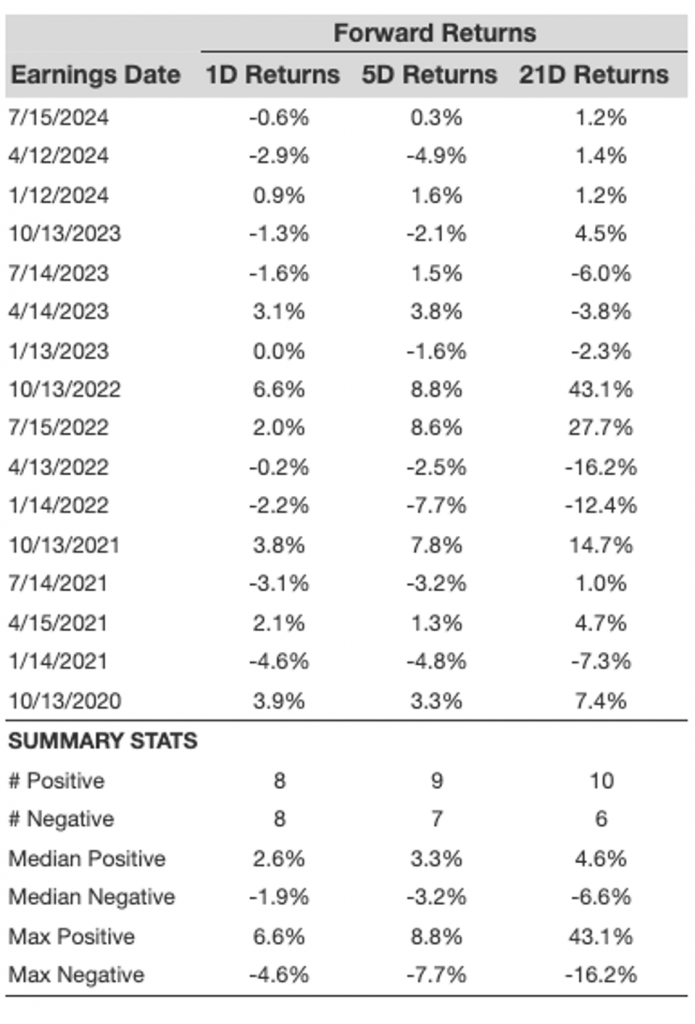
BlackRock’s Historical Odds Of Positive Post-Earnings Return
Here are some insights regarding one-day (1D) post-earnings returns:
- There are 16 earnings data points documented over the last five years, showing 8 positive and 8 negative one-day (1D) returns. In summary, positive 1D returns occurred approximately 50% of the time.
- This percentage remains consistent at 50% when we assess data from the last 3 years instead of 5.
- The median of the 8 positive returns is 2.6%, while the median of the 8 negative returns is -1.9%.
Additional information for observed 5-Day (5D) and 21-Day (21D) returns following earnings is summarized along with the statistics in the table below.
Correlation Between 1D, 5D, and 21D Historical Returns
A relatively lower-risk strategy (though less effective if the correlation is weak) is to examine the correlation between short-term and medium-term returns post earnings, find a pair with the strongest correlation, and execute the corresponding trade. For instance, if 1D and 5D exhibit the highest correlation, a trader can position themselves “long” for the subsequent 5 days if the 1D post-earnings return is positive. Below is some correlation data based on a 5-year and a recent 3-year history. Note that 1D_5D indicates the correlation between 1D post-earnings returns and subsequent 5D returns.
Learn more about Trefis RV strategy that has outperformed its all-cap stocks benchmark (a combination of all three: the S&P 500, S&P mid-cap, and Russell 2000), providing strong returns for investors. Additionally, if you’re looking for upside with a smoother experience than an individual stock like BlackRock, consider the High Quality portfolio, which has outperformed the S&P and achieved more than 91% returns since its inception. Why is this the case? As a group, HQ Portfolio stocks delivered superior returns with reduced risk relative to the benchmark index—a less turbulent experience, as represented in the HQ Portfolio performance metrics.

