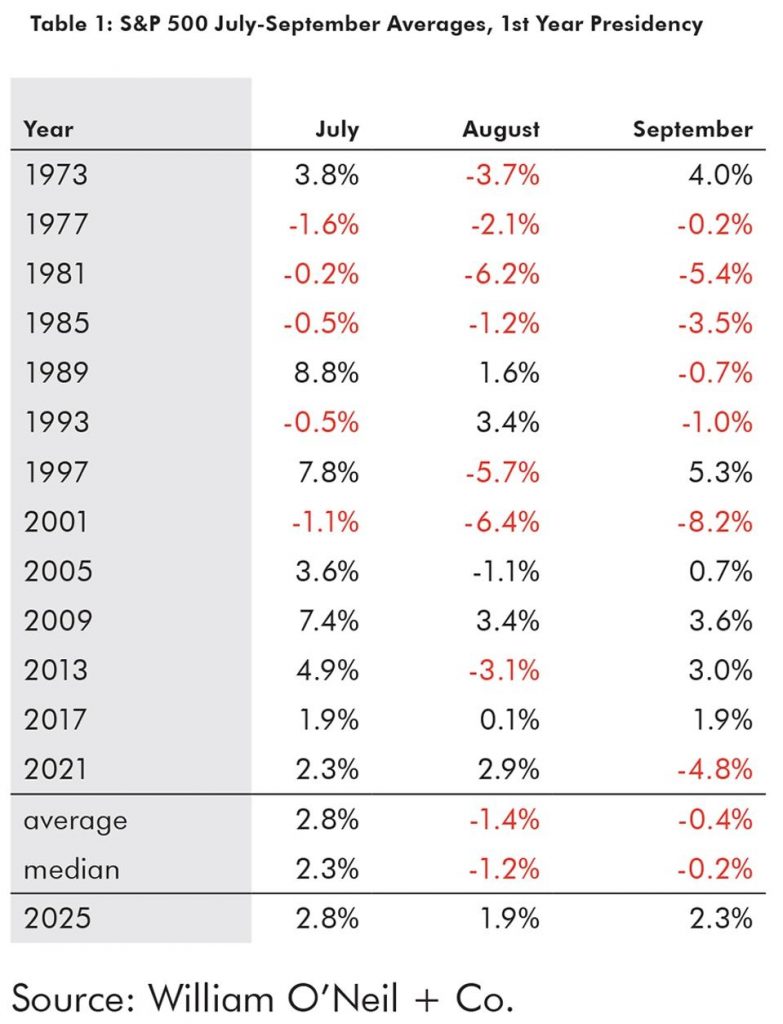
The third quarter of 2025 has been outstanding for U.S. equities, especially impressive against the backdrop of a weak seasonal history in August and September, as seen in Figure 1 below. The market has bucked its normal calendar trend as well as its presidential trend and continued the strong up leg that began in April. As a result, both the S&P 500 and the Nasdaq Composite currently have double-digit gains for the year.
With such a strong overall market, many stocks, groups, and themes have become extended relative to their moving averages and levels of price support. In fact, all sectors except Consumer Staple and Transportation outperformed their Q3 averages, dramatically so for Basic Material, Consumer Cyclical, and Technology, as seen in Figure 2. The last sector, Technology, led all other areas with a gain of +14% so far in Q3. While many of these have the potential to have further gains over time, in the near term they have a heightened risk level.
Looking forward to Q4, the historical setup is strong, however, against the backdrop of abnormal Q3 gains. Normally, all three major indexes average a +5% return in the fourth quarter of the first year of the presidential cycle, as shown in Figure 3. On a month-to-month basis, November is usually the strongest with a median increase of +2.8%. December has the highest success rate with only two losses out of 14 since 1973, as seen in Figure 3. Also, with just one exception in 1973, when August and September are positive, the October-December period is as well, though it is typically slanted toward December gains.
Despite the strong setup into Q4, we are cognizant of the huge moves that leading groups have made over the past six months and would caution that these gains could continue to extend in several areas. A consolidating move sideways or a 5–8% pullback for major indices would be considered normal price action, and the continued lack of such would be more abnormal (i.e., 2017). Tables 3–5 show the leading areas and countries from the U.S. stock market’s April low until today. Many are more than 25% above their 200-DMA. Also, the chart in Figure 4 shows the huge discrepancy between the higher-beta versus lower-beta portfolios since the April lows. This week, the reversion has appeared to have begun and we would not be surprised to see this continue for a short period of time. However, this reversion may resolve the extended and overbought nature of many groups and individual stocks, setting the market up for more positive action before year end.
Here is a list of some of the most extended U.S. stocks versus their 200-DMA (as of Wednesday, September 24) and in many cases versus their most recent base. Even if one is positive on these names, we would look to harvest profits if owned and wait for more attractive entry points if a proper base forms over the next several weeks or months. Many also show climax-top characteristics in recent weeks.
Below are international stocks that rank among the most extended in their home markets. Technology, Basic Material, and Capital Equipment account for the majority of the very extended names here.
In conclusion, this has been one of the strongest third quarters in many years. As a result, many markets, sectors, and individual stocks are extended from their 200-DMA. Also, the S&P 500 is trading at the high end of its P/E ratio at 21.85x forward 12-month earnings on Birinyi Associates estimates. We feel most investors are expecting robust stock performance in the fourth quarter in-line with normal seasonality. We wonder if the market will surprise investors and not follow its historical pattern like it did in Q3 or at least have a pause until later in the quarter. Either way, we suspect that many extended investments will have better entry points over the next few months if investors can be patient. This week’s initial pullback may signal that the overbought areas of the market are beginning to consolidate. We urge investors to wait for proper technical entry points before increasing exposure to them.
Kenley Scott, Director, Global Sector Strategist at William O’Neil + Company, made significant contributions to the data compilation, analysis, and writing for this article.

