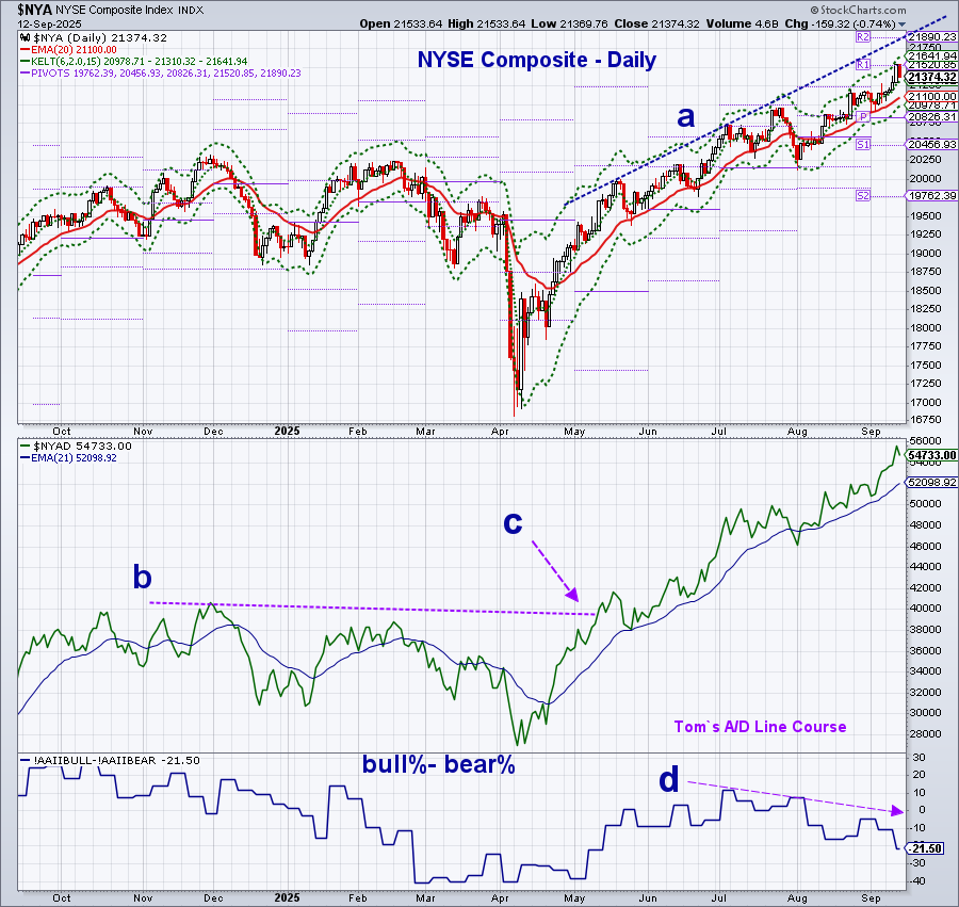
Another impressive week in what is statistically a poor month for the stock market averages. So far this September, the SPDR S&P 500 (SPY) is up 2.1% and the Invesco QQQ Trust (QQQ) is up 2.9%. More new all-time highs for the S&P 500 and Dow Industrial Average as most stock market averages have reached their yearly R1 pivot resistance in the last month.
The NYSE Composite, a broad market average, has been trading above its yearly R1 at 20,903 for most of the month, with a high last week of 21,056. The yearly R2 at 22,252 is 4.1% above the close. The daily chart below has chart resistance, line a, at 21,890 and the monthly R2. Last week, the R1 at 21,520 was tested, with the weekly starc+ band at 22,052.
The NYSE All Advance/Decline line completed its correction in May as the resistance at line b was overcome, as the A/D line made a new high, point c. The other A/D lines confirmed the action, but things changed in August as the NYSE All A/D line started to lead as it made convincing new highs in late August. It has surged even higher in September and made new highs at the end of last week.
This market action was inconsistent with last week’s survey from the AAII. In their survey 49.5% were bearish on stocks for the next six months, while only 28% were bullish. The bull%-bear% was -21.2% which meant that there were 21% more bears than bulls. The lower highs, line d, is not typically seen as the averages are making new highs. The reading is not far below the -30 reading that is historically associated with too low bullish sentiment and market bottoms, not tops.
Though all six of the A/D lines I follow were strong last Thursday, with the NYSE ratio over 4:1 positive, the ratio was 2:1 negative on Friday. For the S&P 500, 54% of the stocks were lower on the day, while 65% of the S&P 1500 closed lower, and 38% of the NDX100 stocks closed lower. As a result, the daily NDX100, Russell 2000, and Dow Industrial A/D all closed negative on Friday. Negative A/D numbers could turn some of the others negative on Monday.
The Invesco QQQ Trust (QQQ) was up 1.8% for the week to close above the August high at $583.32. This completed the trading range of 583.32-551.56, which projects a move to the $615 area. The yearly R1 at $572.08 was decisively overcome last week with the R2 at $626.93. The 20-day EMA at $575.55 is rising again, which is a positive sign with the pivot at $568.47. There is stronger chart support from June at $536.20.
The NDX100 A/D line made its high on July 25th, line a, and has since made lower highs. It closed back below its WMA on Friday with key support at line b. A drop below this level would be consistent with a deeper correction. The daily relative performance (RS) appears to have formed a short-term bottom as it has turned higher after testing its WMA.
This is consistent with the upturn in the IWF/IWD ratio that also favors growth. It broke out to the upside in July, then retested the breakout in August before turning higher.
So where do we go from here? The daily analysis is filled with cross currents, as while the NYSE All A/D line has broken out to the upside, the S&P 500 and NDX100 A/D lines are range-bound. In July, the BofA Global Research fund manager’s survey reported cash levels at 3.9% which is often seen before a market decline. It hit a 15-year low in February of 3.5% which was followed by an ugly decline. A rise to 4.3-4.5% would be encouraging, as it reached this level in May as the correction ended. We should get new data next week.
I would stick with the trend analysis of the daily advance/decline lines for early warnings of more serious stock market corrections.

