Nvidia is the single stock most closely followed and commented upon, especially in its role as the leader of the tech sector. The semiconductor firm, whose AI chips have been a hot item for those involved in the artificial intelligence world, has been considered the number one among tech analysts and investors.
That sense of strength may be changing. Nvidia this week showed how quickly money can find its way elsewhere. What had been a given – this stock will outperform others in the sector and among equities in general – is no longer certain. A close look at price chart performance shows why.
Nvidia: the new price chart look for AI chip designer
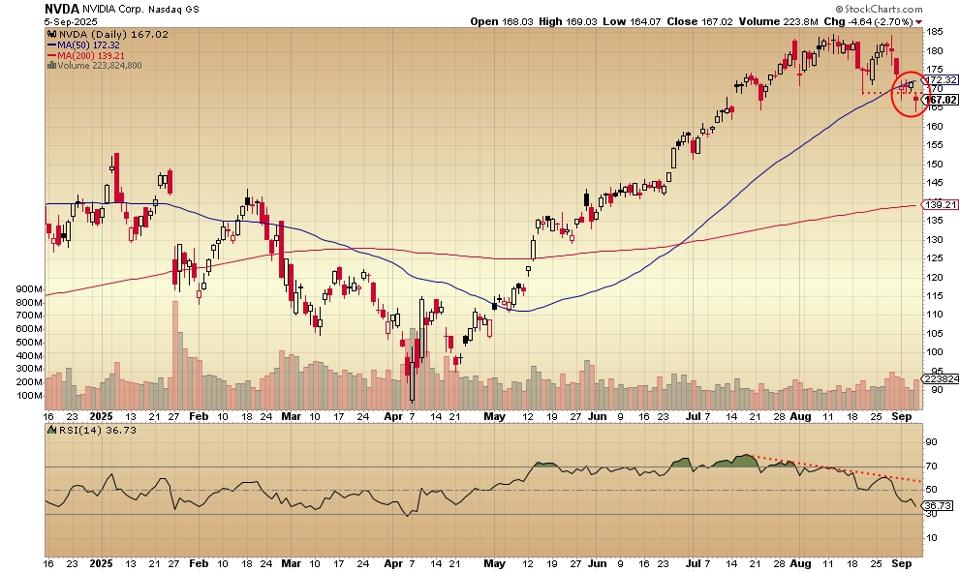
The Nvidia daily price chart now looks like this:
The price now has four closes in a row below the 50-day moving average. Nvidia had managed to stay above it since early May. The stock this week broke below the mid-August low. Friday’s drop came as the S&P 500 hit a new high.
After doubling since the April low, the former tech sector leader is failing to keep up with other stocks. It’s quite stunning to see this take place after such a remarkable performance over so many months.
The Nvidia weekly price chart is here:
The red-circled area shows how the stock has dropped to a lower price for four weeks in a row. It peaked in early August at above $180 and now goes for $167. The relative strength indicator (RSI, below the price chart) is diverging negatively from the direction of price – it peaked in March 2024. Nvidia’s price momo is deteriorating, slowly, according to the look here.
Here’s the monthly price chart for Nvidia:
What a look! From less than $10/share just a few years ago, all the way up to just above $180. It’s no wonder the stock is considered such a powerhouse. The red-circled area shows where the price has declined for two months. Note that the relative strength indicator has declined from late 2024 to the present – heading in the opposite direction of the price.
Here’s the Nvidia point-and-figure chart, for a different perspective:
This chart clearly shows the move up from the April low of $86 to the recent $184 peak and the even more recent drop back to $167. The “double bottom breakdown” indicates the slippage below the $170 mid-August support level seen on the other charts.
The probable underlying meaning of all of this: the hype phase of AI stocks is either over or about over. A more thorough and penetrating look at the phenomenon may be underway. Those that have benefitted from the excitement – Nvidia, for example – are also receiving the deeper analysis.
None of this means that the stock can’t recover, find new buyers, attract the old buyers and continue upward. It could.
Stats courtesy of FinViz.com. Charts courtesy of Stockcharts.com.
No artificial intelligence was used in the writing of this post.
More analysis and commentary at johnnavin.substack.com.

