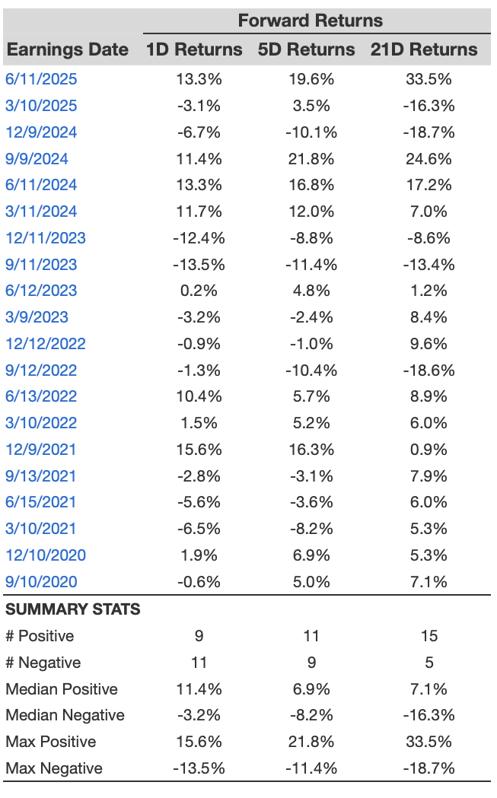
Oracle (NYSE: ORCL) is expected to announce its earnings on Tuesday, Sep 9, 2025. Throughout its history, Oracle’s stock has typically experienced negative returns on the day following earnings announcements. In the past five years, the stock has decreased in 55% of the cases, with a median drop of 3.2% and a maximum one-day decline of 13.5%.
For traders focused on events, recognizing these historical trends can provide a strategic advantage. There are two main strategies you might consider:
- Pre-earnings positioning: Assess historical probabilities and establish a position before the earnings announcement.
- Post-earnings positioning: Analyze the relationship between immediate and medium-term returns after earnings reports are released, then modify your position accordingly.
Analysts estimate Oracle’s earnings to be $1.48 per share on revenues of $15.03 billion. This represents an increase compared to the same quarter last year, when earnings were $1.39 per share on revenues of $13.31 billion. This expected growth is primarily attributed to the rising adoption of Oracle’s cloud services, especially due to its success with generative AI workloads.
Reviewing the fundamentals, Oracle currently boasts a market capitalization of $626 billion. Over the last twelve months, the company generated $57 billion in revenue, along with operating profits of $18 billionand a net income of $12 billion. If you seek returns with less volatility than owning a single stock, consider the High Quality Portfolio. It has significantly outperformed its benchmark, which includes the S&P 500, Russell, and S&P MidCap indices, with returns exceeding 91% since its inception. Additionally, see – AVGO Stock To $600?
See historical earnings reaction data for all stocks
Oracle’s Historical Chances Of Positive Post-Earnings Return
Here are some insights regarding one-day (1D) post-earnings returns:
- There are 20 earnings results documented over the last five years, with 9 positive and 11 negative one-day (1D) returns noted. Overall, positive 1D returns occurred approximately 45% of the time.
- However, this percentage reduces to 42% when evaluating data over the last 3 years instead of 5.
- The median of the 9 positive returns is 11%, while the median of the 11 negative returns is -3.2%
Additional data regarding the observed 5-Day (5D) and 21-Day (21D) returns post earnings are summarized along with the statistics in the table below.
Correlation Between 1D, 5D, and 21D Historical Returns
A less risky strategy (though ineffective if the correlation is low) is to grasp the correlation between short-term and medium-term returns following earnings, identify a pair with the highest correlation, and execute the corresponding trade. For example, if the correlation between 1D and 5D exhibits the highest strength, a trader may decide to position themselves “long” for the subsequent 5 days if the 1D post-earnings return turns out positive. Below is some correlation data based on both a 5-year and a 3-year (more recent) history. Note that the correlation 1D_5D signifies the relationship between 1D post-earnings returns and the following 5D returns.
Is There Any Relationship With Peer Earnings?
Occasionally, the performance of peers can affect stock reactions following earnings. In fact, the market dynamics may start shifting even before earnings announcements. Here is some historical data comparing Oracle stock’s post-earnings performance to the stock performance of peers that reported earnings just prior to Oracle. For a fair comparison, peer stock returns also reflect post-earnings one-day (1D) returns.
Discover more about Trefis RV strategy that has outperformed its all-cap stocks benchmark (the combination of all three, the S&P 500, S&P mid-cap, and Russell 2000), generating strong returns for investors. Additionally, if you desire growth with a more stable trajectory than an individual stock like Oracle, explore the High Quality portfolio, which has surpassed the S&P and achieved >91% returns since its beginning.

