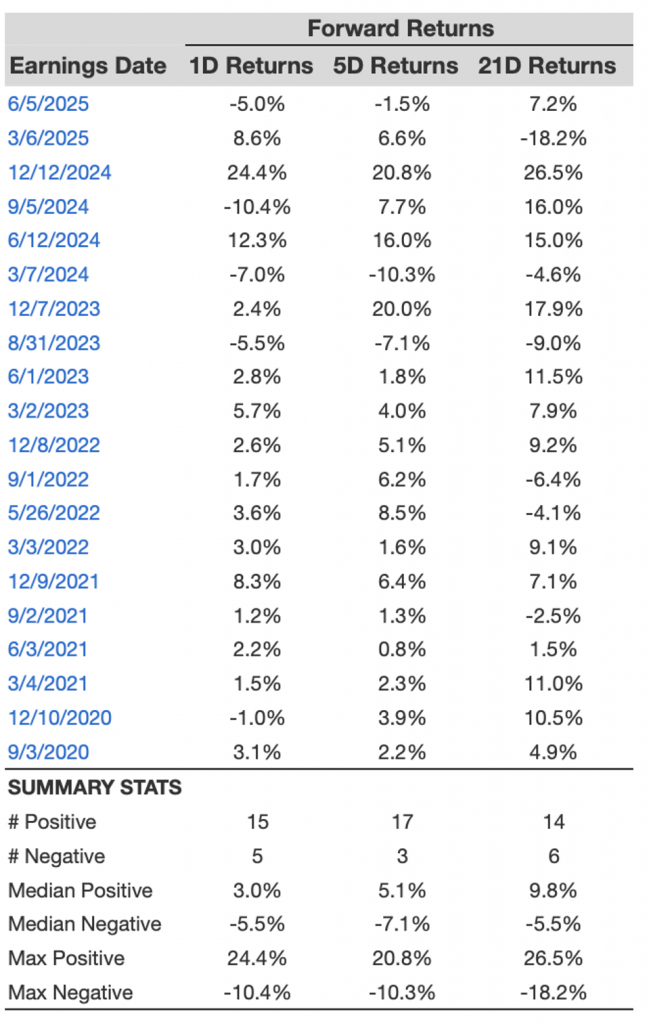
Broadcom (NASDAQ: AVGO) is set to announce its earnings on Thursday, September 4, 2025. Historical records indicate that purchasing AVGO stock prior to the earnings announcement has often been a successful strategy. In the past five years, the stock has recorded positive one-day returns 75% of the time, with a median increase of 3.0% and a peak single-day return of 24.4%.
For traders focused on specific events, having a strong grasp of historical trends can be beneficial, although the results are largely contingent on how the company’s outcomes measure up to market anticipations. Two separate strategies may be employed for events of this nature:
- Pre-Earnings Positioning: Utilizing historical probabilities, one can create a position ahead of the earnings announcement.
- Post-Earnings Positioning: An investor might also examine the relationship between immediate and medium-term returns after earnings are disclosed to guide their trading choices.
Consensus forecasts for the upcoming report predict earnings of $1.66 per share on revenues of $15.82 billion. This indicates significant growth from the same quarter last year, which reported earnings of $1.24 per share and revenues of $13.07 billion.
From a fundamental perspective, Broadcom has a market capitalization of $1.4 trillion. The company has showcased robust financial results over the past year, achieving $57 billion in revenue, $21 billion in operating profits, and $13 billion in net income.
That said, if you’re looking for potential upside with reduced volatility compared to holding an individual stock, consider the High Quality Portfolio. It has significantly outperformed its benchmark—a blend of the S&P 500, Russell, and S&P MidCap indexes—and has achieved returns exceeding 91% since its inception. Additionally, see – Ethereum Play: BMNR Stock To $100?
See earnings reaction history of all stocks
Broadcom’s Historical Odds Of Positive Post-Earnings Return
Here are some insights on one-day (1D) post-earnings returns:
- There have been 20 earnings data points documented over the last five years, with 15 showing positive and 5 indicating negative one-day (1D) returns. Overall, positive 1D returns were observed approximately 75% of the time.
- However, this percentage dips to 67% when we review data for the last 3 years instead of 5.
- The median of the 15 positive returns is 3.0%, while the median of the 5 negative returns is -5.5%
Additional data on the observed 5-Day (5D) and 21-Day (21D) returns after earnings are summarized alongside the statistics in the table below.
Correlation Between 1D, 5D, and 21D Historical Returns
A less risky strategy (although not useful if the correlation is weak) is to understand the correlation between short-term and medium-term returns following earnings, identify a pair that has the strongest correlation, and execute the necessary trade. For instance, if 1D and 5D exhibit the highest correlation, a trader may position themselves “long” for the subsequent 5 days if the 1D post-earnings return is positive. Below is some correlation data based on a 5-year and a 3-year (more recent) history. Please note that the correlation 1D_5D refers to the relationship between 1D post-earnings returns and the following 5D returns. Also, see – Buy or Fear AVGO Stock?
Is There Any Correlation With Peer Earnings?
Occasionally, the performance of peers can impact the stock reaction following earnings. In fact, the pricing may begin even before the earnings are revealed. Below is some historical data on the past post-earnings performance of Broadcom stock in comparison to the stock performance of peers that announced earnings just before Broadcom. For a fair comparison, peer stock returns are also represented as post-earnings one-day (1D) returns.
Discover more about Trefis RV strategy which has outperformed its all-cap stocks benchmark (combining all three indexes: the S&P 500, S&P mid-cap, and Russell 2000), yielding strong returns for investors. Additionally, if you desire upside with a steadier experience compared to an individual stock like Broadcom, explore the High Quality portfolio, which has outpaced the S&P and achieved >91% returns since it began.

