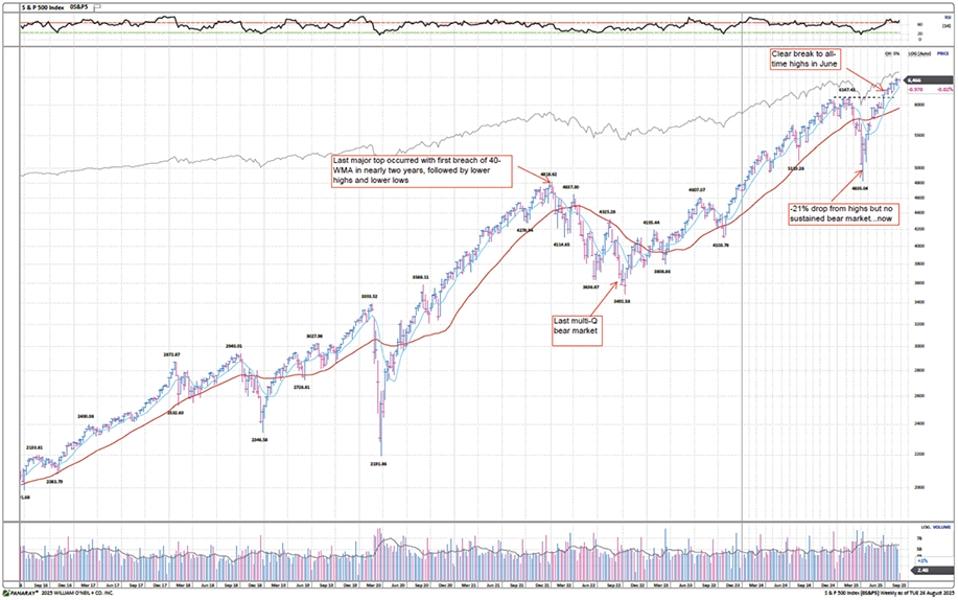
As we have noted in several of our recent pieces, the U.S. stock market’s recovery from its April lows to today has been remarkable. The S&P 500 and Nasdaq are both up more than 10% for the year as of this writing on August 27. Also remarkable is the fact that the market has not had a 5% or greater pullback since the start of the rally.
Table 1: Largest S&P 500 Rally Legs 1970–2025
As a result, we are seeing one of the strongest and most consistent uplegs in recent memory. This is illustrated below in Figures 2–4, which have the key U.S. indices weekly charts with notations of recent breaks into all-time highs coming off the early-2025 sharp correction (or bear market).
Figure 1-3: S&P 500, DJIA, and Nasdaq Composite Weekly Charts
In terms of the bull market math, there are some competing figures. On the one hand, the DJIA and the S&P 500 never really went through a bear market drop (we use -25% as historical threshold) in the March/April selloff this year. So, both are actually well beyond the overall median (DJIA since 1900) bull market length, but still below the average. The Nasdaq went through a technical bear market (-27%) after having come very close to the typical bull market run from 2022–2024.
Table 2: Bull Market History for DJIA and Nasdaq Indices
This raises the question: Did we reset or not? Figure 4 highlights one chart that argues against a reset, showing mega-cap concentration relative to the S&P 500 and small-cap stocks. In past periods where the market became concentrated at the top, it took a full bear market to reset this concentration to a normalized level (also not shown, 1970s). We are a bit skeptical that small-caps can take over leadership in a sustained way without a reset of the mega-caps (i.e.: unlikely for mega-caps to lag if we grind higher from here).
Figure 4: Nasdaq 100 vs. S&P 500 and Russell 2000 vs. S&P 500, 1987–2025
For over four years now, small-caps have been stuck in a range, generating rolling bull and bear markets, but with no real secular progress as shown in Figure 5.
Figure 5: Russell 2000 Weekly Chart
One thing that happened with the quick drop in March/April is that many base counts of individual stocks were reset despite the S&P 500 and DJIA overall not technically entering bear markets. These resets have provided fuel for the ongoing rally since April.
Table 3: Breakdown of U.S. Stocks by Base Stage Count
But this is just the most recent base formation. Some of these will always fail, some will complete with a breakout, and some will continue basing. The all-important number of breakouts is next to monitor. An ongoing issue with the market, which relates to its concentration, is that breakouts have not had a surge in a long time. Ex-Financials (which includes a large and increasing number of ETFs), the breakout number surged in November 2024 but has made lower highs on subsequent surges. Also, it has been clearly lower than the 2020–2021 and 2017 periods as seen in Figure 7. So, either this is a warning of continued lack of participation and fragility in the market, or we should sometime soon see a large surge of breakouts from the current uninspiring recent range.
Figure 6–7: Weekly U.S. Breakouts, and Breakouts ex-Financials, 2015–2025
In conclusion, while this has been a remarkable stock market, the percentage returns and length of time of the run are still below what is average for a bull market. We have two main concerns related to the present bull market. First, the market continues to be concentrated in mega-cap stocks. Second, the number of stocks breaking out continues to be lackluster. We suspect for this bull market to continue, more stocks will need to participate, and leadership will need to broaden, thus reducing the percentage of the market in the mega-caps. If this does not occur, we believe distribution is likely to increase and a pullback or correction is more likely.
Kenley Scott, Director, Global Sector Strategist at William O’Neil + Company, made significant contributions to the data compilation, analysis, and writing for this article.

