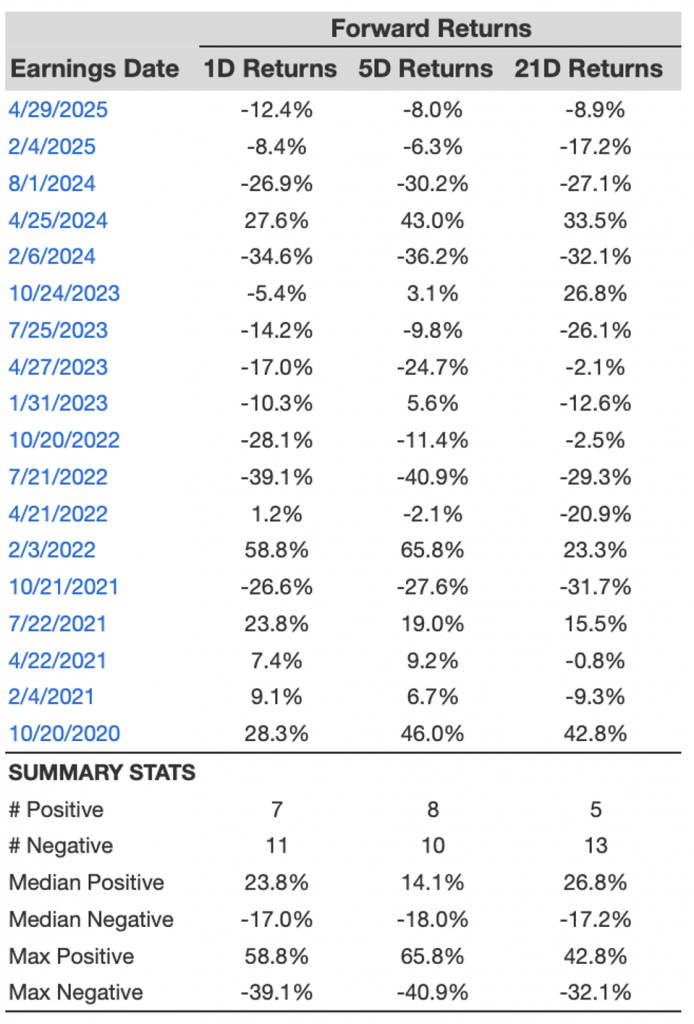
Snap (NYSE:SNAP) is set to disclose its earnings on Tuesday, August 5, 2025. Throughout the last five years, Snap’s stock has often responded unfavorably to earnings announcements. In 61% of cases, the stock has experienced a negative one-day return following the results. The median one-day decrease has been a noteworthy -17.0%, with a peak one-day fall of -39.1%.
For traders focused on events, recognizing these historical trends can be beneficial; however, the actual outcomes compared to consensus and expectations will be critical. There are two primary strategies to keep in mind:
- Pre-Earnings Positioning: Evaluate the historical probabilities and take a stance before the earnings announcement.
- Post-Earnings Positioning: Assess the relationship between immediate and medium-term returns once the earnings are released to inform your positioning.
Analysts expect Snap to declare earnings of $0.02 per share alongside sales of $1.35 billion. This is compared to earnings of $0.02 per share with sales of $1.24 billion in the same quarter from the previous year.
At present, Snap has a market capitalization of $16 billion. Over the past twelve months, the company generated $5.5 billion in revenue. However, the company was operationally unprofitable, recording $-648 million in operating losses and a net loss of $-532 million.
Nonetheless, if you are looking for potential gains with lower volatility than individual stocks, the Trefis High Quality portfolio offers an alternative — it has surpassed the S&P 500 and achieved returns exceeding 91% since its inception.
View earnings reaction history of all stocks
Snap’s Historical Likelihood of Positive Post-Earnings Returns
Some insights regarding one-day (1D) returns following earnings:
- There are 18 earnings data points collected over the past five years, featuring 7 positive and 11 negative one-day (1D) returns identified. In summary, positive 1D returns occurred approximately 39% of the time.
- However, this figure drops to 10% when analyzing data from the last 3 years instead of 5.
- The median of the 7 positive returns is 24%, while the median of the 11 negative returns is -17%
Additional data for observed 5-Day (5D) and 21-Day (21D) returns after earnings are outlined along with the statistics in the table below.
Relationship Between 1D, 5D, and 21D Historical Returns
A relatively lower-risk approach (though ineffective if the correlation is minimal) involves understanding the connection between short-term and medium-term returns following earnings, identifying a pair with the strongest correlation, and executing the suitable trade. For instance, if 1D and 5D exhibit the highest correlation, a trader can take a “long” position for the subsequent 5 days if the 1D post-earnings return is positive. Below is some correlation data derived from a 5-year and a more recent 3-year history. Please note that the correlation 1D_5D indicates the relationship between 1D post-earnings returns and the consequent 5D returns.
Does Peer Earnings Correlate?
Occasionally, peer performance can affect the stock’s response post-earnings. Indeed, the market may start to price in effects before the earnings are announced. Here is some historical data reflecting the past post-earnings performance of Snap stock compared with the stock performance of peers that disclosed earnings immediately before Snap. For accurate comparison, peer stock returns also denote post-earnings one-day (1D) returns.
Discover more about Trefis RV strategy that has outperformed its all-cap stocks benchmark (a combination of all three: the S&P 500, S&P mid-cap, and Russell 2000), producing excellent returns for investors. Additionally, if you are interested in potential gains with a smoother experience than an individual stock like Snap, consider the High Quality portfolio, which has surpassed the S&P and achieved >91% returns since its inception.

