Altria (NYSE:MO) is set to announce its earnings on Wednesday, July 30, 2025. For traders focused on events, gaining insight into historical stock performance during earnings periods can offer a significant advantage, although the actual outcomes versus consensus estimates will primarily influence market reactions.
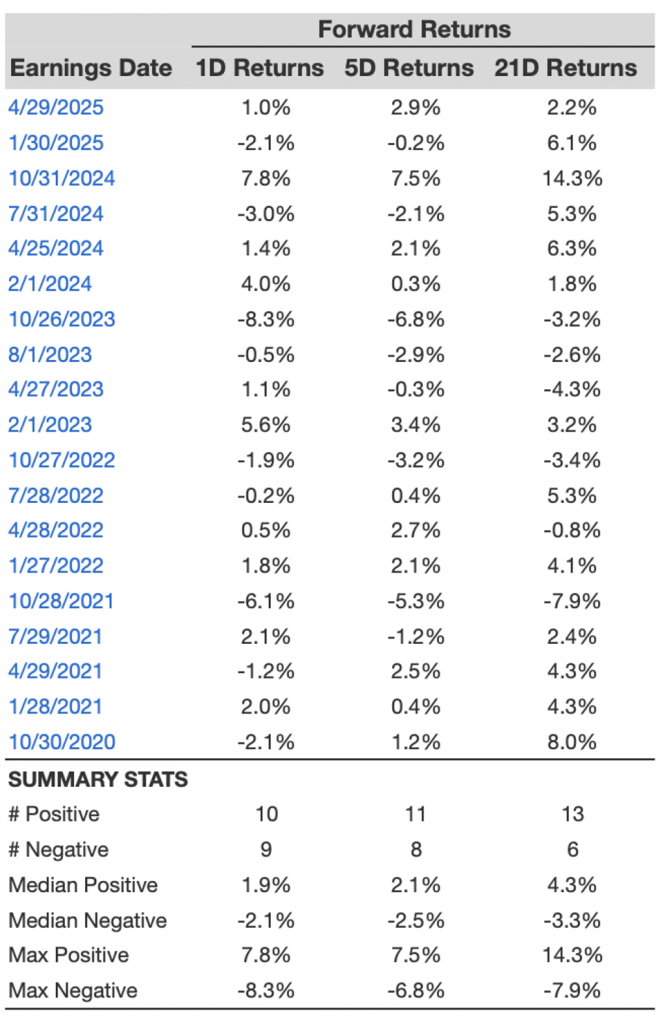
In the past five years, Altria’s stock has delivered a positive one-day return in 53% of the cases following earnings announcements. When the returns were positive, the median one-day increase was 1.9%, with the highest one-day increase reaching 7.8%.
Two key strategies to consider include:
- Pre-Earnings Positioning: Using historical probabilities, you might opt to establish a position ahead of the earnings release.
- Post-Earnings Positioning: Following the release of earnings, you can evaluate the immediate and mid-term stock reactions to inform your trading choices.
Analysts project that Altria will report earnings of $1.38 per share on revenues of $5.19 billion. This is in comparison to the same quarter last year, during which Altria reported earnings of $1.31 per share on revenue of $5.28 billion.
From a fundamental standpoint, Altria has a current market capitalization of $101 billion. In the past twelve months, the company generated $20 billion in revenue, with $12 billion in operating profits and a net income of $10 billion, indicating robust operational profitability.
Nonetheless, if you are looking for growth with less volatility compared to individual stocks, the Trefis High Quality portfolio offers an alternative—it has outperformed the S&P 500 and produced returns greater than 91% since its launch. Also, check out – Time To Buy Centene Stock?
See earnings reaction history of all stocks
Altria’s Historical Odds Of Positive Post-Earnings Return
Here are some insights on one-day (1D) post-earnings returns:
- There are 19 earnings data points documented over the last five years, with 10 positive and 9 negative one-day (1D) returns observed. In summary, positive 1D returns were noted approximately 53% of the time.
- Interestingly, this percentage climbs to 55% if we consider data from the last 3 years instead of 5.
- The median of the 10 positive returns is 1.9%, while the median of the 9 negative returns is -2.1%
Additional information regarding observed 5-Day (5D) and 21-Day (21D) returns following earnings is included along with the statistics in the table below.
Correlation Between 1D, 5D, and 21D Historical Returns
A relatively less risky approach (although it may not be beneficial if the correlation is weak) is to grasp the correlation between short-term and medium-term returns following earnings, identify the pair with the highest correlation, and execute the suitable trade. For instance, if 1D and 5D demonstrate the highest correlation, a trader can adopt a “long” position for the next 5 days if the 1D post-earnings return is favorable. Below is some correlation data based on 5-year and 3-year (more recent) history. Note that the correlation 1D_5D refers to the correlation between 1D post-earnings returns and subsequent 5D returns.
Is There Any Correlation With Peer Earnings?
Occasionally, the performance of peers can impact post-earnings stock reactions. In fact, the pricing might start prior to the earnings announcement. Below is some historical data comparing the past post-earnings performance of Altria stock with the performance of peers that reported earnings just before Altria. For a fair comparison, peer stock returns also reflect post-earnings one-day (1D) returns.
Discover more about Trefis RV strategy that has outperformed its all-cap stocks benchmark (combination of the S&P 500, S&P mid-cap, and Russell 2000), producing strong returns for its investors. Additionally, if you’re looking for growth with a less turbulent experience than investing in a single stock like Altria, consider the High Quality portfolio, which has surpassed the S&P and yielded >91% returns since its inception.

