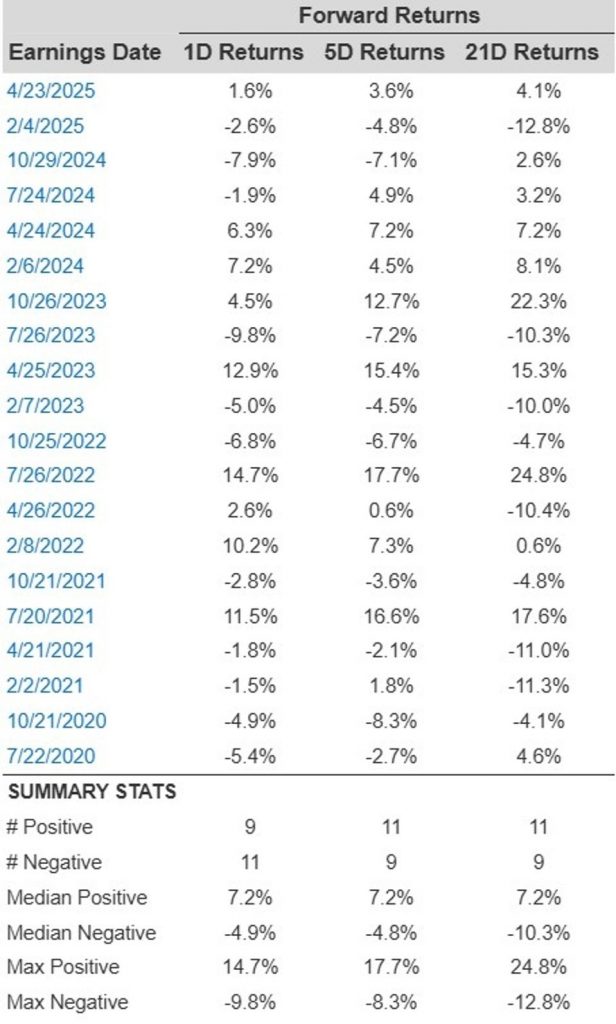
Chipotle Mexican Grill (NYSE: CMG) is set to reveal its fiscal second quarter results on Wednesday, July 23, 2025. Analysts expect the company to announce earnings of $0.33 per share with $3.11 billion in sales. This would indicate no growth in earnings and a 5% increase in sales compared to the figures from the prior year of $0.33 per share and $2.97 billion, respectively. Historically, CMG has experienced a decline after earnings 55% of the time, with an average one-day drop of 4.9% and a maximum decline of 10%.
In Q1, Chipotle’s revenue increased by 6% to $2.88B, and adjusted EPS rose by 7% to $0.29, but comparable sales declined by 0.4% as transactions fell by 2.3%, which offset a 1.9% increase in average check size. Operating margins decreased by 130 basis points to 26.2% due to higher food, labor, and portion expenses, with tariffs anticipated to reduce margins by another 50 basis points. Q2 is predicted to be difficult due to tough comparable sales and the timing of Easter. For 2025, Chipotle anticipates low single-digit comparable sales growth, with traffic expected to improve in the latter half of the year. The company currently has a market capitalization of $73 billion. Revenue over the past twelve months was $11 billion, and it achieved operational profitability with $2.0 billion in operating profits and net income of $1.6 billion.
For event-driven traders, historical patterns can provide an advantage, whether by positioning before earnings or responding to post-release movements. However, if you are looking for less volatility than individual stocks, the Trefis High Quality portfolio offers an alternative, having outperformed the S&P 500 and achieving returns greater than 91% since its inception.
Chipotle’s Historical Odds Of Positive Post-Earnings Return
Here are some insights on one-day (1D) post-earnings returns:
- Over the past five years, there are 20 earnings data points recorded, with 9 positive and 11 negative one-day (1D) returns noted. Overall, positive 1D returns were observed approximately 45% of the time.
- It’s important to note that this ratio rises to 50% when evaluating data from the last 3 years instead of the past 5.
- The median of the 9 positive returns is 7.2%, while the median of the 11 negative returns is -4.9%
Further data regarding the observed 5-Day (5D) and 21-Day (21D) returns post earnings is summarized along with the statistics in the table below.
Correlation Between 1D, 5D, and 21D Historical Returns
A relatively less risky approach (though not effective if the correlation is minimal) is to assess the correlation between short-term and medium-term returns following earnings, identify a pair displaying the highest correlation, and perform the appropriate trade. For instance, if 1D and 5D indicate the strongest correlation, a trader can take a “long” position for the next 5 days if the 1D post-earnings return is positive. Below is some correlation data based on a 5-year and 3-year (more recent) history. The correlation 1D_5D indicates the relationship between 1D post-earnings returns and subsequent 5D returns.
Discover more about Trefis RV strategy that has outperformed its all-cap stocks benchmark (including the S&P 500, S&P mid-cap, and Russell 2000), delivering strong returns for investors.

