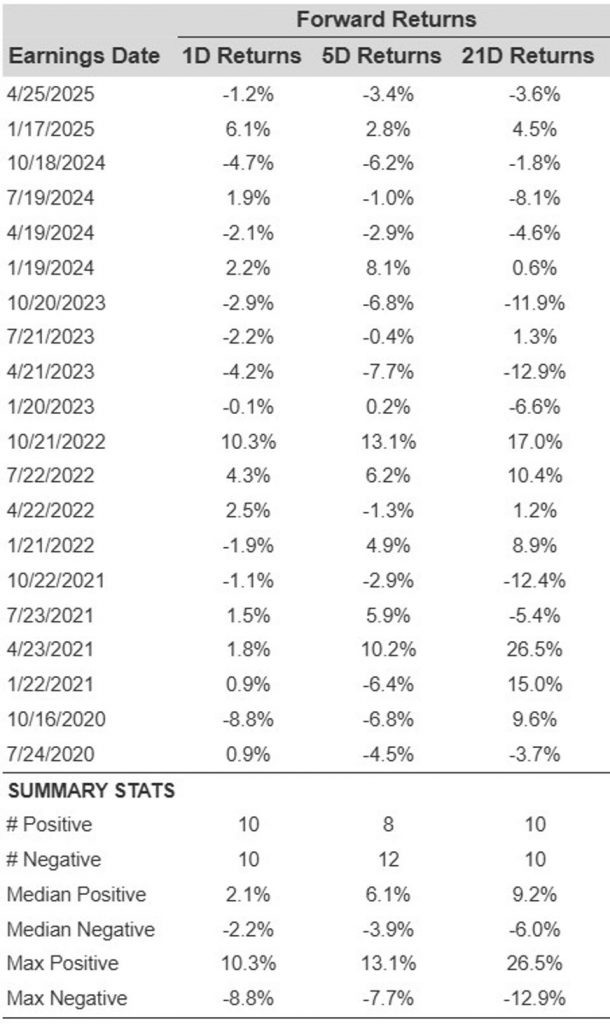
SLB’s stock (NYSE: SLB) is scheduled to announce its fiscal second-quarter earnings on Friday, July 18, 2025. Analysts forecast that the firm will disclose earnings of $0.75 per share on $8.51 billion in revenue. This would indicate a 4% decrease in earnings and a 7% drop in revenue compared to last year’s figures of $0.78 per share and $9.15 billion, respectively. Historically, the stock has increased after earnings reports 50% of the time, with a median one-day gain of 2.1% and a maximum increase of 10%.
SLB reported mixed results for Q1 2025, with revenue declining 3% to $8.5B and net income decreasing 25% to $797M. Revenue from North America rose by 8% while international markets saw a 5% decline in Q1. SLB’s $8B all-stock acquisition of ChampionX obtained final approval from UK regulators on July 15, overcoming the last obstacle for the deal to finalize on Wednesday. The merger, already approved in the U.S., will incorporate ChampionX’s chemicals and automation into SLB’s production systems.
The company boasts a current market capitalization of $48 billion. Revenue for the past twelve months amounted to $36 billion, with operational profitability reflected in $6.3 billion in operating profits and net income of $4.2 billion. While much will depend on how these results compare to consensus and expectations, understanding historical trends could favor event-driven traders.
For event-driven traders, historical trends can provide an advantage, whether through positioning ahead of earnings or responding to movements post-release. For those seeking upside with less volatility than individual stocks, the Trefis High-Quality portfolio offers an alternative, having outperformed the S&P 500 and generated returns exceeding 91% since its launch. See earnings reaction history of all stocks.
SLB’s Historical Odds Of Positive Post-Earnings Return
Here are some insights regarding one-day (1D) post-earnings returns:
- Over the past five years, there have been 20 recorded earnings data points, yielding 10 positive and 10 negative one-day (1D) returns. To summarize, positive 1D returns occurred approximately 50% of the time.
- This percentage decreases to 42% when analyzing data for the last 3 years instead of 5.
- The median of the 10 positive returns is 2.1%, while the median of the 10 negative returns is -2.2%
Further data on 5-Day (5D) and 21-Day (21D) returns post earnings is compiled in the table below.
Correlation Between 1D, 5D, and 21D Historical Returns
A relatively lower-risk strategy (though ineffective if the correlation is minimal) is to assess the correlation between short-term and medium-term returns after earnings, identify a pair with the strongest correlation, and execute the suitable trade. For instance, if 1D and 5D show the strongest correlation, a trader can take a long position for the following 5 days if the 1D post-earnings return is positive. Below is some correlation data derived from the 5-year and 3-year (more recent) history. Please note that the correlation 1D_5D pertains to the relationship between 1D post-earnings returns and subsequent 5D returns.
Learn more about Trefis RV strategy that has outperformed its all-cap stocks benchmark (a combination of the S&P 500, S&P mid-cap, and Russell 2000), generating substantial returns for investors.

