Copper stocks backed off slightly this week after hitting new 2025 highs last week following President Trump announcement that he would be imposing tariffs on the metal. Whether his copper tariff will remain in place is a question given the number of times Trump has flip-flopped on tariffs of various kinds.
That the metal – and the stocks — could not hold the new highs likely failed to surprise metals markets experts. Morgan Stanley analysts on Tuesday said prices could go up as the cost of bringing copper into the US increases, but that it was likely to be a short-term rise as domestic inventory grows.
3 Copper Stocks and A Copper ETF: Up, Then Down A Bit
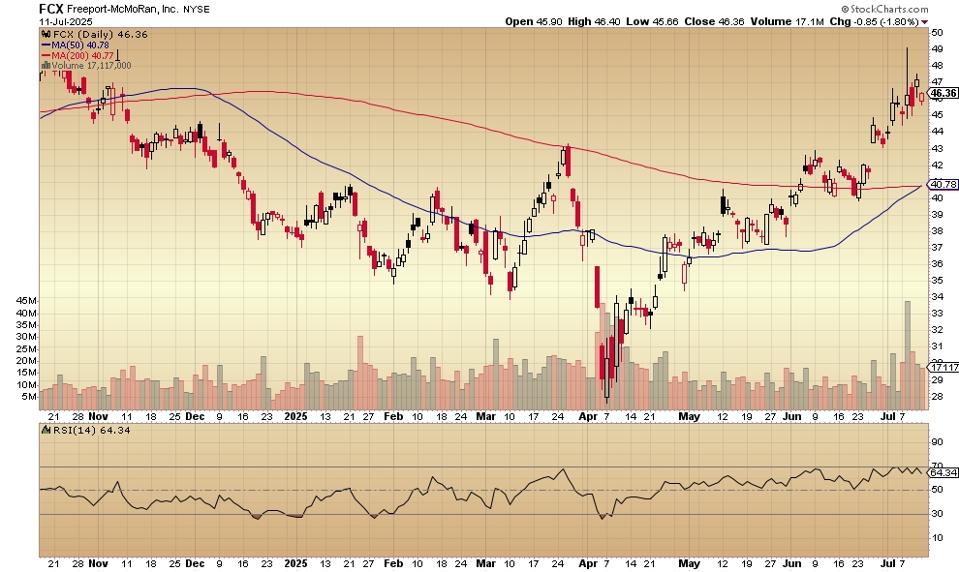
This is the big copper stock followed by the institutions and the hedge funds. If a copper stock is needed in the portfolio, this is the first one that gets looked at. Market capitalization is $66.58. The price-earnings ratio is 38. The debt-to-equity ratio is .53. Freeport pays a 1.29% dividend.
You can see the new 2025 high came in early July after Trump’s announcement and the volume bar shows heavy buying. Note that the 50-day moving average is now crossing above the 200-day moving average for the first time this year, a confirmation of the strength despite the selling since the high.
This Toronto-based miner has a market cap of $4.14 billion. This year’s earnings are up by 49%. The price-earnings ratio is 27 and the debt-to-equity ratio is .45. The company pays a dividend of .17%. BMO Capital Markets in April resumed coverage of the stock with an “outperform” rating.
Hudbay Minerals in June broke above the February high of near $9.75 and kept going higher. The peak in early July at just above $11 came with the tariffs-on-copper news. The price has dipped to $10.48 since then as some sellers took advantage of the price pop. The 50-day moving average in late June crossed above the 200-day.
Market cap is $81 billion. The company has corporate offices in Mexico, Peru and Arizona. Earnings this year are up by 10.20% and up over the past five years by 18%. The stock trades with a price-earnings ratio of 22.69. The debt-to-equity ratio is .83. Southern Copper offers investors a 3.13% dividend.
The price in early July slid from the peak of $109 to the present $101.61 – from the tariff news to the assessment of it. This recent high failed to make it above the November 2024 high. The 50-day moving average is trending upward but has yet to cross above the 200-day moving average – almos there.
This fund has 40 holdings of copper stocks. Net assets come to $2.03 billion. The ETF is designed by Global X to provide a broad, diversified group of stocks in the sector. The largest position is First Quantum Minerals, a Canadian miner traded on the Toronto Exchange. The second largest is Freeport-McMoRan.
It’s a positive that the 50-day moving average at the beginning of July crossed above the 200-day moving average. The volume was heavy at the time of the tariff news — a probable confirmation of strength – and it has waned as the selling came in a few days later.
Stats courtesy of FinViz.com. Charts courtesy of Stockcharts.com.
No artificial intelligence was used in the writing of this post.
More analysis and commentary at johnnavin.substack.com.

