U.S. Market Seasonality into Second Half
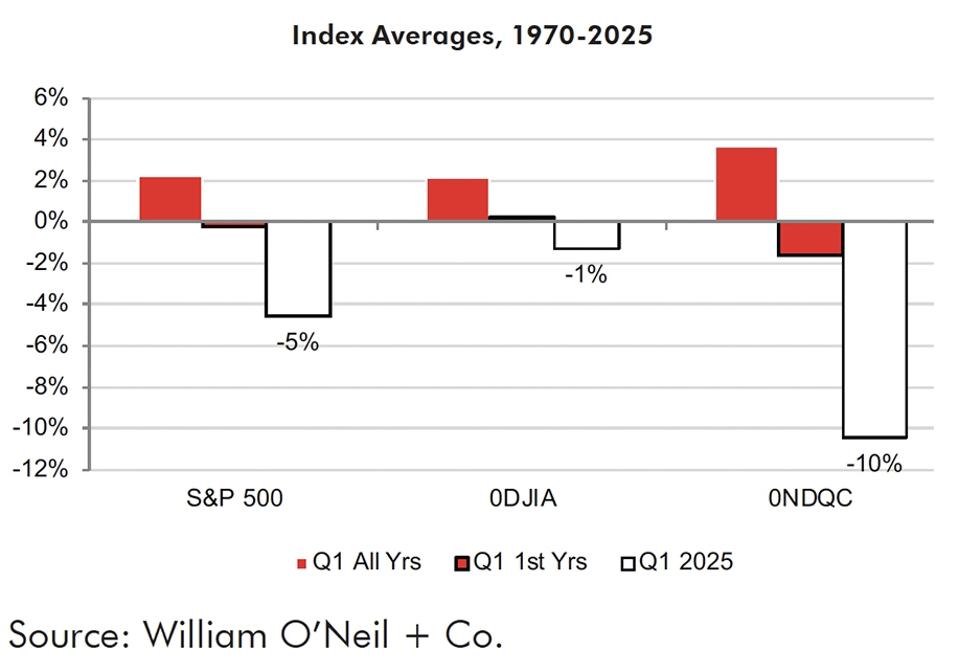
Through the bulk of the first half, the U.S. market has performed closely in line with its history in the first year of the presidential cycle.
However, the path was far from smooth on a quarterly basis. Q1 significantly underperformed an already weak historical precedent, while Q2 sharply outperformed a typically strong one.
By sector, outside of strength in Financials and weakness in Transportation, the averages did not align quite as well with history. Materials, Capital Equipment, Technology, and Utility sharply outperformed their history. But Cyclical, Staple, Energy,
Health Care, and Retail uncharacteristically underperformed.
Quarter-by-quarter it was more aligned with history in terms of sector placement. Most notably, Consumer Cyclical and Technology were among the worst in Q1 and among the best in Q2, which was in line with history. Materials, Capital Equipment and Financials beat their history in both quarters, while Transports lagged in both.
Looking to the second half, the main indices averages are a bit better than the first half, most notably the Nasdaq. However, most of the gains come from strong Q4 averages, while Q3 is mixed.
By sector, there is not that great of a spread from best to worst, and with the exception of 2-3% average gains for Cyclicals, Staples, and Utility, the other eight sectors average between 6-8%.
Now taking a closer look at the upcoming Q3 period, here is a breakdown of the monthly performance for the S&P 500 in Q3 periods. July is positive eight of 13 times, with only slightly losses in the five negative years. But August is a sharp turn
lower, with eight of 13 negative and generally larger down years versus up years. September is more mixed, with six up and seven down years, but has had the tendency for sizable moves in both directions.
Kenley Scott, Director, Global Sector Strategist at William O’Neil + Company, made significant contributions to the data compilation, analysis, and writing for this article.

